


Most cash flow KPI articles are definitional. Operating cash flow, free cash flow, days sales outstanding, current ratio, then a closing line about cash being king. If you are running FP&A delivery for a book of clients, the definitions were never the constraint.
The constraint is deciding which of these metrics actually changes what a client does next, then calculating them identically across twenty or thirty clients sitting on four different chart of accounts structures, then refreshing them every month without rebuilding the logic. That is a delivery architecture problem wearing a metrics costume.
What follows is the working set of cash flow KPIs that earn a permanent slot in a recurring client deliverable, how each one behaves differently depending on the business model in front of you, and what has to be true operationally for them to hold up across a portfolio.
Why cash flow KPIs break down at the portfolio level
Individually, every metric below is trivial to compute. The failure mode is never the arithmetic. It shows up in three places.
- Source inconsistency. A DSO figure built from a QuickBooks AR aging report and one built from a balance sheet average will not match, and the gap widens for clients with material credit memos or progress billing. If your team pulls from whichever source is convenient that month, the trend line is noise.
- Mapping variance. Two clients in the same industry with different account structures will produce different free cash flow numbers under the same definition, because capex is buried differently. Cross-client benchmarking dies here.
- Backward-looking framing. A DSO number describes what already happened. It is a reporting artifact. The advisory value sits in what the metric implies about the next ninety days of cash, and that requires a forecast underneath the metric, not just a trailing calculation.
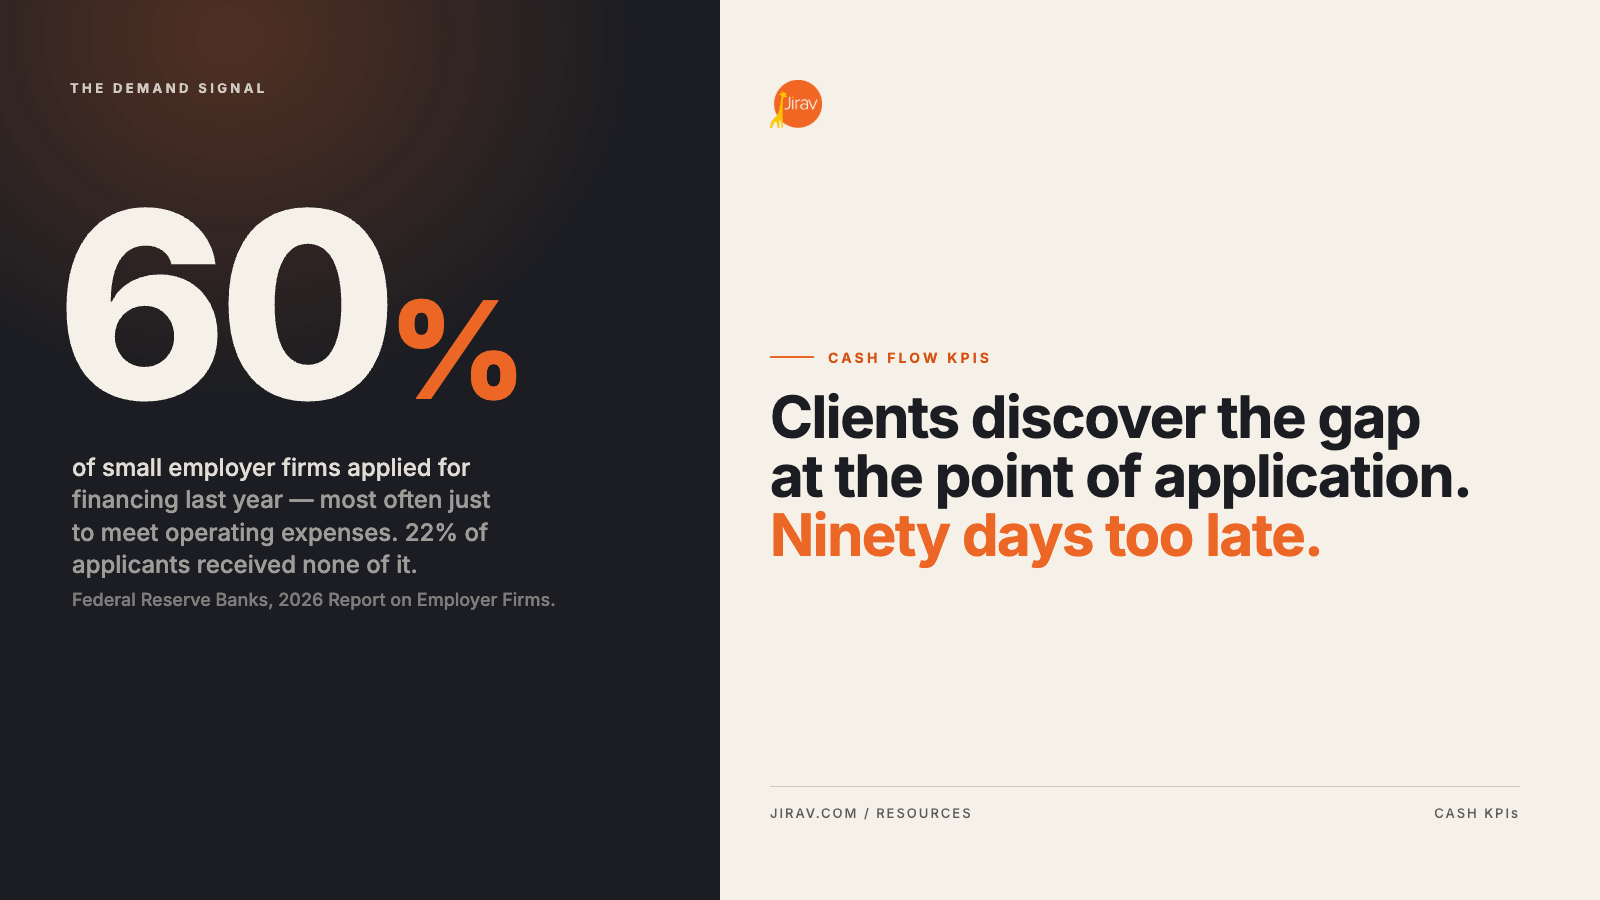
The third point is the one that separates a reporting engagement from an advisory engagement. The demand signal is not subtle: in the Federal Reserve Banks' 2026 Report on Employer Firms, 60 percent of small employer firms applied for financing in the prior twelve months, and the single most common reason was to meet operating expenses. Twenty-two percent of applicants received none of what they sought. Clients are hitting cash constraints they did not see coming, and they are discovering the gap at the point of application rather than ninety days earlier when it was still solvable.
Operating cash flow and the earnings quality check
Operating cash flow is cash generated by the core business before financing and investing activity. Reported on its own it is a scoreboard number. Reported as a ratio against net income, it becomes a diagnostic.
Operating cash flow to net income ratio = OCF / net income. Sustained readings below 1.0 across three or more consecutive quarters mean earnings are not converting to cash. For SMB clients on accrual, the culprit is almost always receivables or inventory rather than accrual estimates in the technical sense. Chase it there first.
One practitioner note that saves rework: for clients who keep cash basis books for tax and accrual for management reporting, decide which basis the KPI package runs on and reconcile once at the model level. Presenting a cash-basis OCF alongside accrual-basis revenue in the same dashboard invites a question you cannot answer cleanly in a client meeting.
Free cash flow, and why it needs a firm-level standard
Free cash flow = operating cash flow minus capital expenditures. The formula is settled. The inputs are not.
Which capex counts is a judgment call, and it is the judgment that makes cross-client comparison possible or impossible. Maintenance capex only, or total capex including growth investment? Are finance lease principal payments treated as capex-equivalent or left in financing? Post-ASC 842, right-of-use asset additions have to be handled deliberately or they distort the number for any client with a meaningful lease footprint.
The recommendation is procedural rather than technical: pick one definition, document it in the firm's delivery standards, and apply it across the entire book. A firm that lets each engagement lead define free cash flow independently loses the ability to benchmark clients against each other, which is one of the few structural advantages a multi-client advisory practice has over an internal finance team.
The cash conversion cycle and its three components
Cash conversion cycle = DSO + DIO minus DPO. It measures how many days elapse between paying for inputs and collecting from customers. For working-capital-intensive clients it is the single most actionable cash metric you can put in front of an owner, because every component has a named owner inside the business.
For professional services and agency clients, replace DIO with unbilled revenue days: work delivered but not yet invoiced, expressed in days of revenue. It is the same concept and it usually reveals a larger cash leak than anything in the receivables column, because unbilled work has not even started the collection clock.
Cash runway and cash buffer days
Runway is the standard framing for pre-profit companies: cash balance divided by monthly net burn. It is the wrong frame for a profitable client with seasonal swings, because the average masks the trough.
Cash buffer days = current cash balance / average daily cash outflows. This is the more portable version. It asks how many days of outflows the current balance covers if inflows stop entirely, which is closer to how an owner actually experiences a cash scare.
The benchmark is sobering. The JPMorgan Chase Institute's analysis of roughly 597,000 small businesses found that the median firm holds enough cash to cover 27 days of typical outflows, with a quarter of firms holding 13 days or fewer. Industry dispersion is wide: restaurants sit near the bottom, real estate near the top.
Do not import a generic three-month target into a client model. Set the buffer target from the client's own volatility: measure the standard deviation of monthly net cash flow over the trailing twenty-four months, then size the buffer to cover a two-standard-deviation month plus the longest historical collection delay. That number is defensible in a board meeting. A round three months is not.
Debt service coverage and covenant headroom
DSCR = net operating income / total debt service. For any client carrying bank debt, the covenant test is usually the binding constraint on decision-making, not the P&L. A client can be profitable, growing, and one equipment purchase away from a technical default.
The advisory move is to forecast the covenant rather than report it. Run the covenant calculation forward through the plan period under base, downside, and expansion scenarios, and show the client the month where headroom compresses. That is a conversation that changes behavior. A trailing DSCR in a monthly package is a number the client glances at and forgets.
Collection effectiveness index
CEI = [(beginning AR + credit sales minus ending AR) / (beginning AR + credit sales minus ending current AR)] x 100. It expresses collections performance as a percentage of what was collectible in the period.
CEI is a better month-to-month operating metric than DSO because it is not distorted by sales timing. A client whose revenue doubled in the period will show a worse DSO even with flawless collections. CEI will not. Use DSO for trend narrative and client comparison; use CEI to evaluate whether the collections function is doing its job.
Forecast accuracy as a KPI
This one is aimed at your own delivery rather than the client's operations, and it is the one clients notice fastest.
Track the variance between forecast and actual cash position at the four-week, eight-week, and thirteen-week horizons, and hold the trailing average. A cash forecast that lands within five percent at four weeks and ten percent at thirteen weeks is credible enough to be used for decisions. One that swings twenty percent at four weeks is a document the client stops reading, and no amount of dashboard polish rescues it.
Publishing your own accuracy figure to the client is an aggressive move that pays off. It reframes the forecast from a deliverable into a managed instrument, and it gives you the standing to push back when a client's assumptions are the source of the variance.
Standardizing the calculation across a client portfolio
Everything above is achievable in Excel for one client. The problem is the twenty-ninth client, refreshed on the fifth business day, by a staff member who did not build the original model.
This is the operational case for a purpose-built FP&A platform rather than a spreadsheet stack. Jirav was built for multi-client advisory delivery specifically, and three capabilities do most of the work on cash KPIs.
- Map once, calculate consistently. Client chart of accounts structures get mapped to a firm-standard reporting structure a single time through the accounting and payroll integrations. Every downstream KPI then computes off the same normalized structure, which is what makes cross-client benchmarking possible without a manual reconciliation step.
- A KPI library rather than bespoke formulas. The reporting and dashboards layer ships with out-of-the-box metrics and supports firm-defined custom metrics that can be cloned across the book. Your free cash flow definition gets set once and inherited by every client model, which is exactly the standardization problem described earlier.
- Forward-looking metrics, not just trailing ones. Because the underlying model is driver-based across all three statements, every cash KPI can be computed on forecast periods as well as actuals. Cash buffer days at month nine under a downside scenario is a different conversation than cash buffer days as of last Tuesday. Auto Forecast gives you a defensible starting baseline built from historicals and seasonality, which you then override where you have better information than the algorithm does.
The practical outcome is that the cash KPI package stops being rebuilt each month and becomes an artifact of the model. Several firms in Jirav's customer stories describe that shift as the point where advisory margin actually improved, because the recurring hours moved from production into analysis.
Turning cash flow KPIs into a client conversation
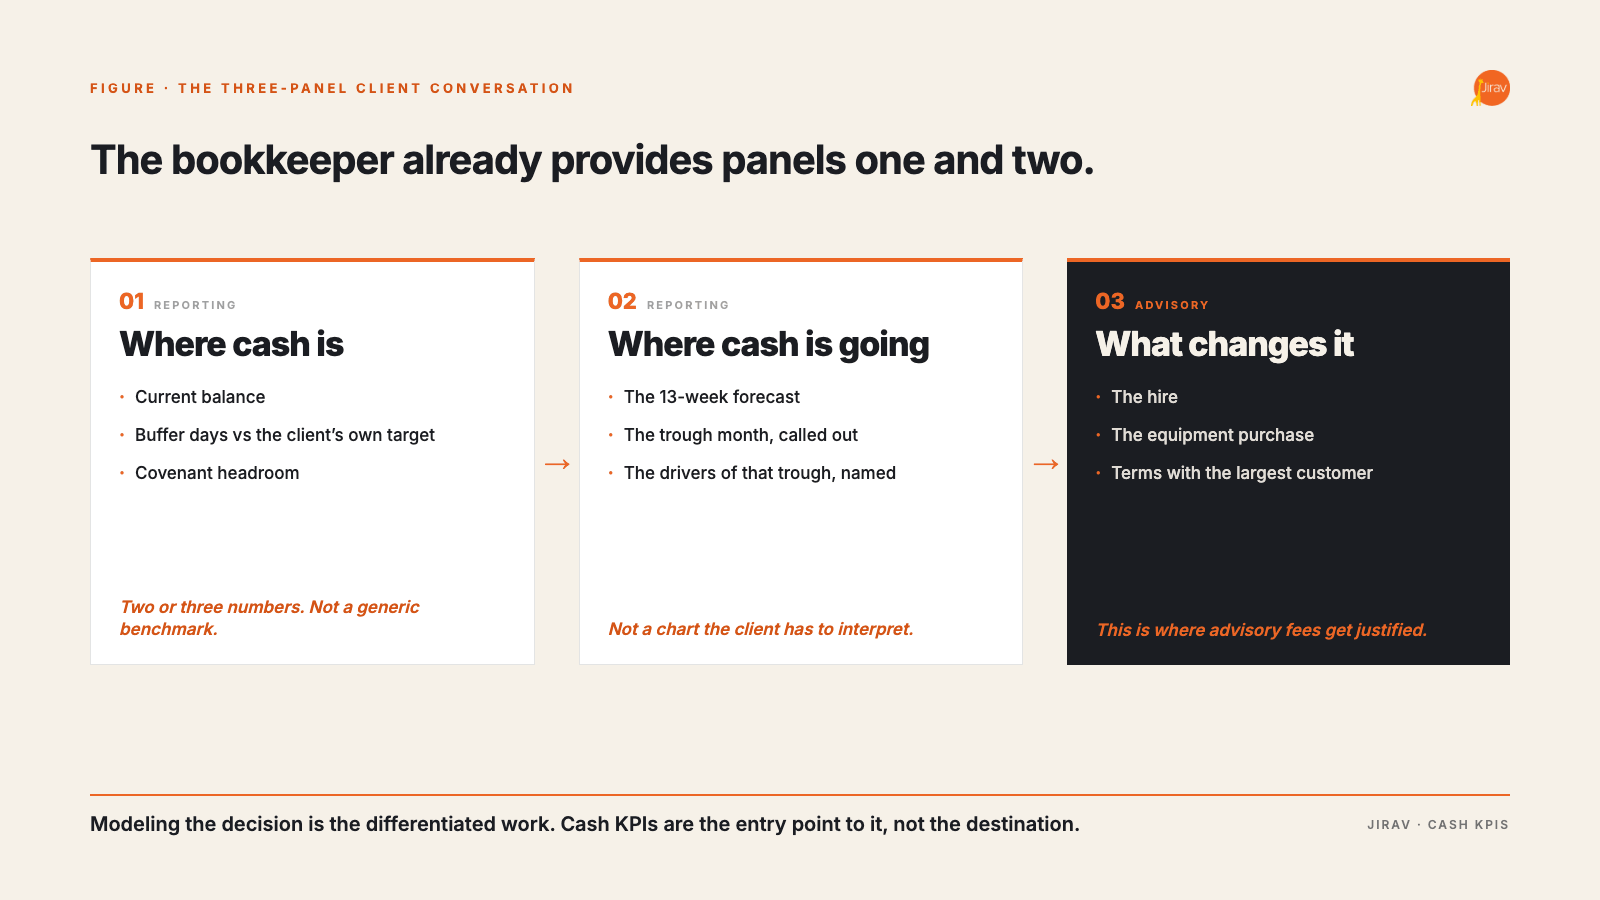
A dashboard with eleven cash metrics on it is a dashboard nobody reads. The structure that works in a monthly or quarterly client session has three panels.
- Where cash is. Current balance, buffer days, covenant headroom. Two or three numbers, stated against the client's own target rather than a generic benchmark.
- Where cash is going. The thirteen-week forecast, with the trough month called out explicitly and the drivers of that trough named. Not a chart the client has to interpret.
- What changes it. Two or three scenario comparisons showing the cash impact of decisions actually on the table: the hire, the equipment purchase, the terms renegotiation with the largest customer.
The third panel is where advisory fees get justified. Panels one and two are reporting, and reporting is what the client's bookkeeper already provides. Modeling the decision is the differentiated work, and cash flow KPIs are the entry point to it rather than the destination.
Frequently asked questions
What are the most important cash flow KPIs to monitor?
For most SMB clients the working set is operating cash flow, free cash flow, the cash conversion cycle with its DSO, DIO, and DPO components, cash buffer days, and debt service coverage where bank debt exists. Collection effectiveness index is worth adding for any client where receivables are the primary cash constraint. The specific mix should follow the client's business model rather than a standard template: inventory metrics are noise for a services firm, and unbilled work-in-progress days matter far more.
How often should cash flow KPIs be reviewed?
Trailing KPIs refresh monthly with the close. The rolling cash forecast that sits underneath them should refresh weekly for any client operating below roughly forty-five buffer days, and biweekly above that. Clients in a covenant-constrained position or a reimbursement-based revenue model need weekly regardless of buffer level, because the timing risk is structural rather than incidental.
What is a good cash conversion cycle?
There is no portable benchmark, and quoting one usually damages credibility. Cycle length is driven by business model: subscription software collects before delivering and can run negative, while a distributor carrying sixty days of inventory on thirty-day supplier terms will run well above ninety. The useful benchmark is the client's own trailing twenty-four months and the direction of travel. A cycle shortening by five days per quarter is a good story regardless of the absolute number.
How do cash flow KPIs differ for services versus product businesses?
The main substitution is on the inventory axis. Services clients replace days inventory outstanding with unbilled work-in-progress days, which captures delivered work that has not yet entered the billing cycle. Services clients also tend to have concentrated revenue, which makes customer-level DSO more informative than a blended figure. Product businesses need the inventory component and generally warrant a separate gross margin bridge, because margin compression and cash compression are frequently the same event observed from two angles.
From monitoring to modeling
Every KPI in this article can be produced from historical data. That is the low bar, and it is where most client reporting stops. The version that changes client behavior is the same metric set computed forward, under multiple scenarios, refreshed without manual rebuild.
If your firm is producing cash KPIs but rebuilding the calculation each month, the constraint is the toolchain rather than the methodology. The methodology above is sound. Making it repeatable across a growing client base is a platform decision.
|
See what cash flow KPIs look like when the model does the work Jirav maps your clients' accounting data once, then computes cash KPIs on actuals and forecast periods across every client in your book. Standardize the definitions, clone the package, and spend the recurring hours on analysis instead of production. |