

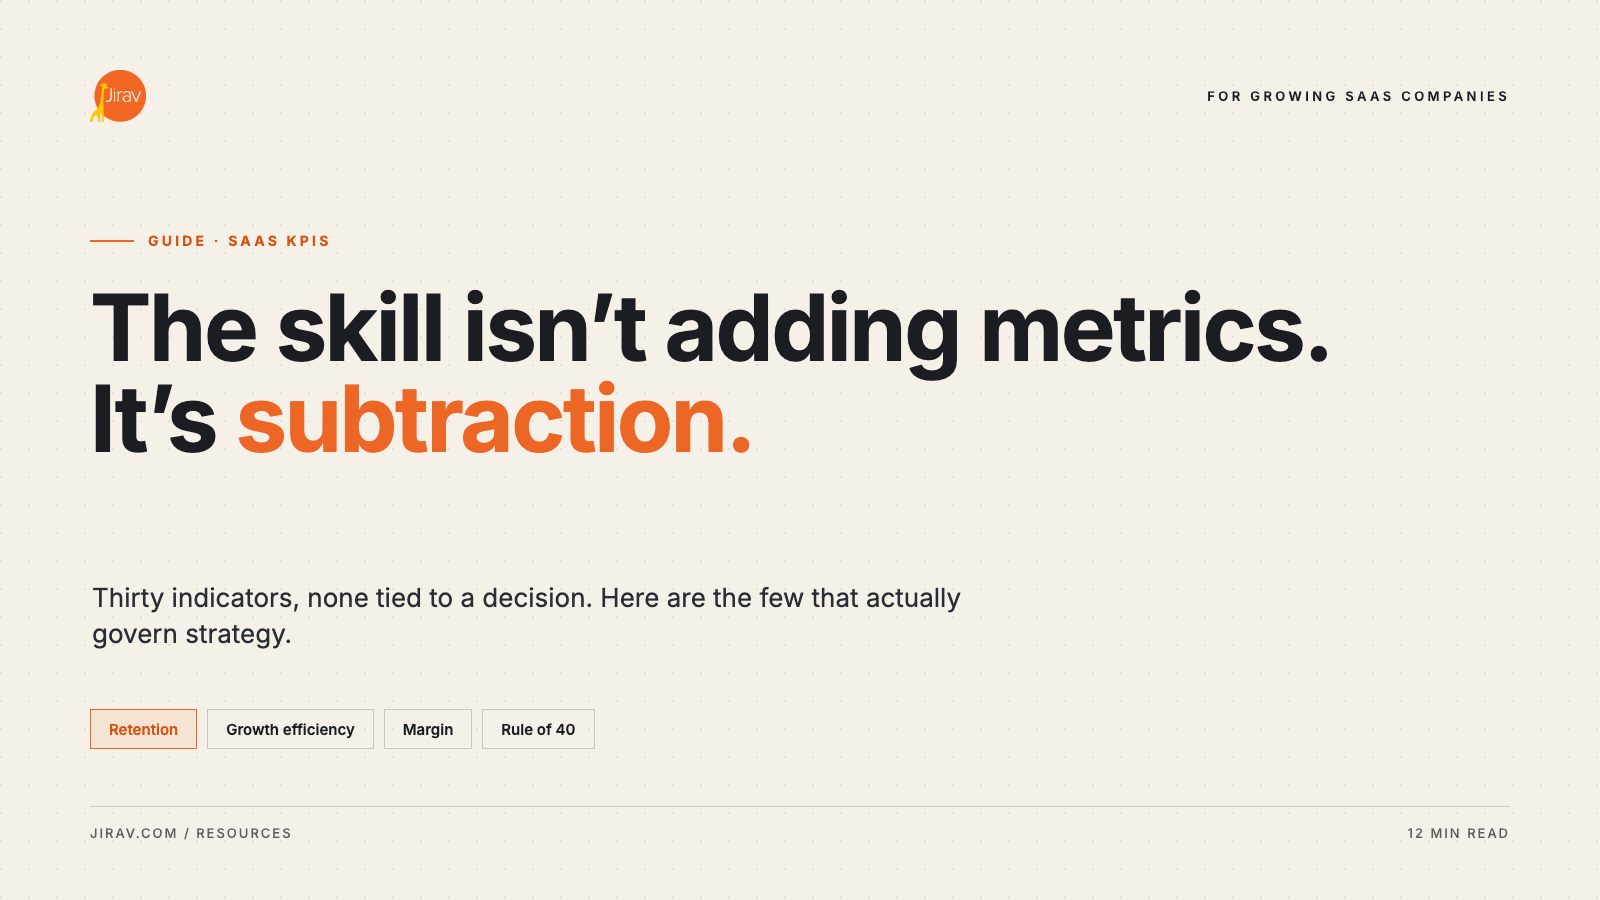
No business model produces metrics like SaaS does. Recurring revenue, cohort behavior, and usage data mean you can measure almost anything, and that abundance is the trap. Growth-stage dashboards routinely swell to thirty indicators, each defensible on its own, none of them clearly tied to a decision. The skill is not adding metrics. It is subtraction: knowing the few that actually govern strategy and letting the rest be diagnostic detail.
For the firms and finance leaders steering a growing SaaS company, the metrics below are the ones worth putting at the center. They are chosen not because they are popular but because each one changes a decision, and because they reinforce each other when read together.
Retention is the engine, so start there
If you can watch only one number, watch net revenue retention. NRR captures expansion, contraction, and churn in a single figure, and it answers the question that determines whether growth is efficient: does the existing customer base grow on its own before you spend a dollar acquiring anyone new? Above 100 percent, the business compounds from customers it already has. Below 100 percent, every new sale first has to backfill what leaked out.
Benchmarks make NRR readable, but only against the right peer group. In SaaS Capital's 2025 survey of private B2B SaaS companies, median NRR for companies in the $25,000 to $50,000 average-contract-value tier sat around 102 percent, with top-quartile firms near 111 percent. The segment matters: an SMB-focused product at 97 percent can be sitting exactly at its benchmark, while an enterprise product at the same number has a real problem, because enterprise accounts are supposed to expand.
Read NRR alongside gross revenue retention, which strips out expansion and shows the raw floor: how much revenue you keep before any upsell masks the losses. A healthy NRR sitting on a weak GRR is expansion covering for churn, and that is a fragile way to grow.
Retention is also where the compounding lives. SaaS Capital's data shows the relationship between retention and growth is exponential rather than linear: moving NRR up a few points lifts the growth rate more than the raw numbers suggest, and that gap widens over a three-to-five-year horizon. That is why retention deserves the top slot ahead of any acquisition metric.
Growth is only as good as its efficiency
A growth rate on its own says nothing about whether the growth is worth having. For context, SaaS Capital put the 2025 median growth rate for private B2B SaaS companies at around 25 percent, down from prior years, so a headline number only becomes meaningful once you pair it with the cost of getting it.
CAC payback is the most intuitive place to start: how many months of gross-margin revenue it takes to earn back the fully loaded cost of acquiring a customer. It maps directly to cash and to how long the business is underwater on each new logo.
The SaaS magic number and the burn multiple do similar work at the company level: how much new recurring revenue each dollar of sales and marketing, or each dollar of total burn, actually buys. When these deteriorate while the top line still grows, the business is buying growth at a rising price, which is precisely the pattern that looks fine on a revenue chart and painful on a cash-flow statement.
Growth quality also shows up in where the growth comes from. New-logo ARR and expansion ARR are not interchangeable: a business leaning entirely on new logos to hit its number is running a harder, more expensive motion than one growing meaningfully from its installed base. Splitting ARR growth into new, expansion, and churned components tells you which engine is actually running. Benchmarkit's 2025 SaaS Performance Metrics report tracks these efficiency measures across a large private-company sample, which makes them useful reference points when you are deciding whether a client's growth is efficient or expensive.
Margin and the composite view
Gross margin sets the ceiling on everything else. A subscription business should carry high software-subscription gross margin; when services drag the blended number down, that is a signal about the delivery model, not a rounding issue. LTV-to-CAC is worth watching too, but only when lifetime value is built from real retention curves rather than an optimistic churn assumption, which is where a lot of LTV math quietly falls apart.
Then there is the Rule of 40, the one composite that belongs on the executive summary. Growth rate plus profit margin should clear 40 percent. Its usefulness is that it forces the trade-off into the open: a company growing 60 percent while burning can clear it, and so can one growing 15 percent with real margin, but a business that is both slow-growing and unprofitable cannot hide. It is a fast read on whether growth and discipline are in balance.
The metrics are only as good as the model behind them
Here is the part that separates a scorecard that drives decisions from one that just decorates a deck. Every metric above depends on consistent definitions and a data model that produces them the same way every month. NRR calculated one way in the first quarter and another way in the third is worse than no NRR at all. The moment these numbers live in a hand-built spreadsheet that someone re-keys each period, they drift, and the drift stays invisible until a board meeting.
This is where a purpose-built FP&A platform matters. Jirav ties KPIs to the underlying financial model rather than treating them as standalone cells. Its KPI library and dashboarding calculate metrics like retention, CAC payback, and runway consistently across periods and clients, and its driver-based modeling lets you forecast those same metrics forward instead of only reporting them after the fact. For an advisory firm, that means the SaaS scorecard is standardized across the book, defensible in front of a client's board, and ready to drop into each monthly reporting package. For an internal team, it means the metrics on the dashboard and the numbers in the forecast come from one source instead of three.
Fewer metrics, better instrumented
The temptation in SaaS is always to measure more. The advantage goes to the teams that measure less: choose the metrics that actually govern decisions, retention first, then the efficiency of growth, then margin and the Rule of 40 as a composite, and instrument them in a single model so the numbers are consistent enough to trust. A tight, well-built scorecard beats a sprawling one every quarter, because the point was never to watch everything. It was to know what to do next.
|
See how Jirav standardizes SaaS KPIs across your client base and ties them to a live forecast. |