REPORTING & DASHBOARDS | ACCOUNTING & CFO FIRMS
Standardize and Scale Your Practice with Jirav
Experience seamless efficiency with Jirav’s automated reporting and dashboard deliverables that can be standardized across your client base. Free up staff time to dig deeper into the analysis and provide your clients with actionable insights to drive more strategic, long-lasting client relationships.

Financial and Management Reporting
Generate beautiful, interactive reports and dashboards
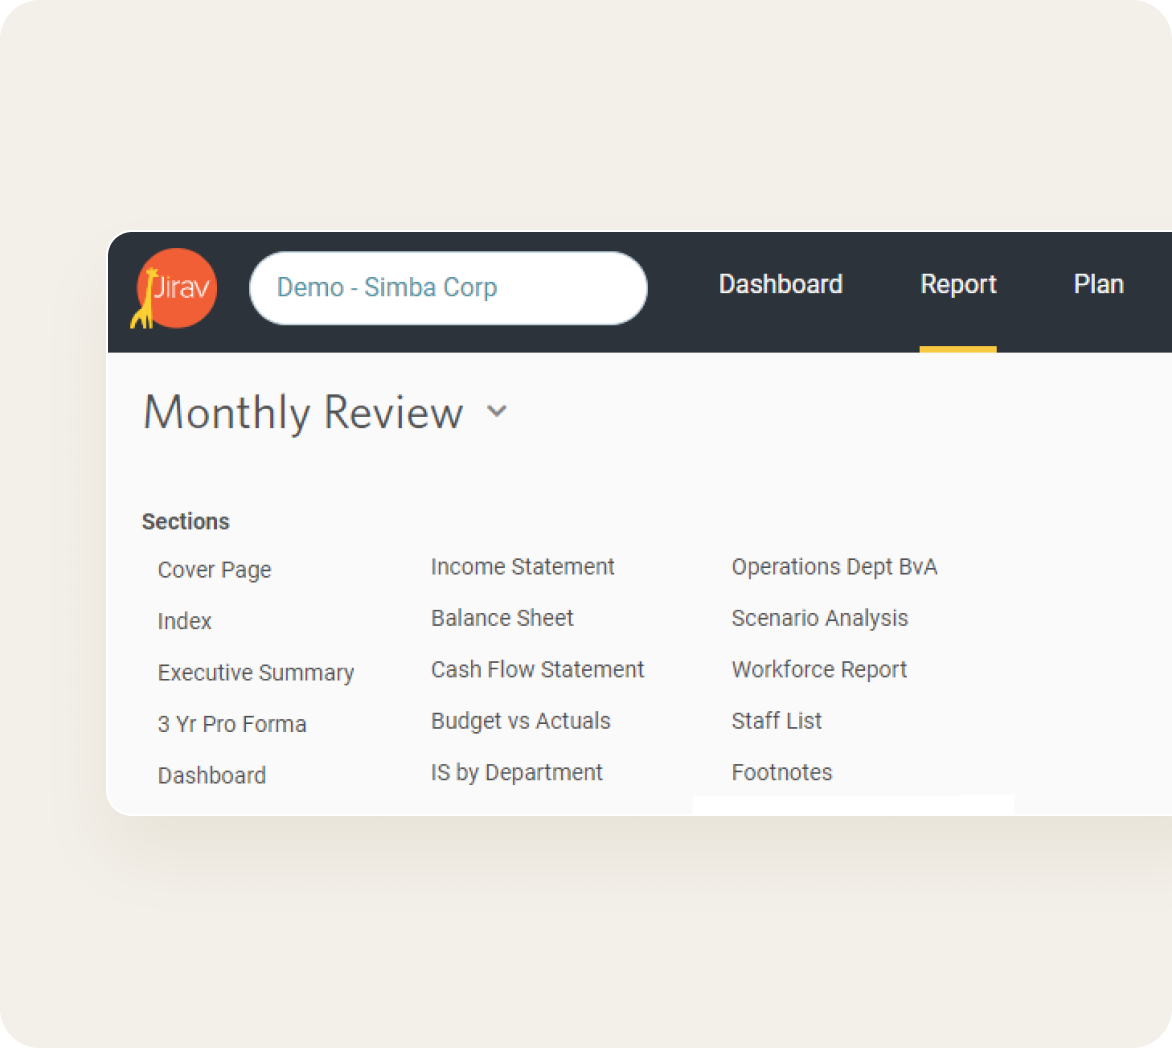
Replace manual, time-consuming reporting processes with engaging reports and visuals in Jirav. Take advantage of our seamless integrations to quickly connect to your client’s accounting data and access pre-configured income statements, balance sheets, and cash flow statements within minutes. Say goodbye to the hours spent each month organizing and mapping the chart of accounts for planning and reporting purposes. With Jirav, you can create a customized mapping once, defining your client deliverables efficiently.
Jirav’s pre-designed templates include customizable 3-way financials as well as reports that can be created from scratch to fit your client’s unique requirements. Standardize and clone your deliverables effortlessly across your client base or industry sectors while incorporating firm branding and footnotes for a polished look. Quickly onboard new clients while scaling your practice.
Jirav’s pre-designed templates include customizable 3-way financials as well as reports that can be created from scratch to fit your client’s unique requirements. Standardize and clone your deliverables effortlessly across your client base or industry sectors while incorporating firm branding and footnotes for a polished look. Quickly onboard new clients while scaling your practice.
Budget vs Actuals and Scenario Analysis
Perform easy side-by-side comparisons
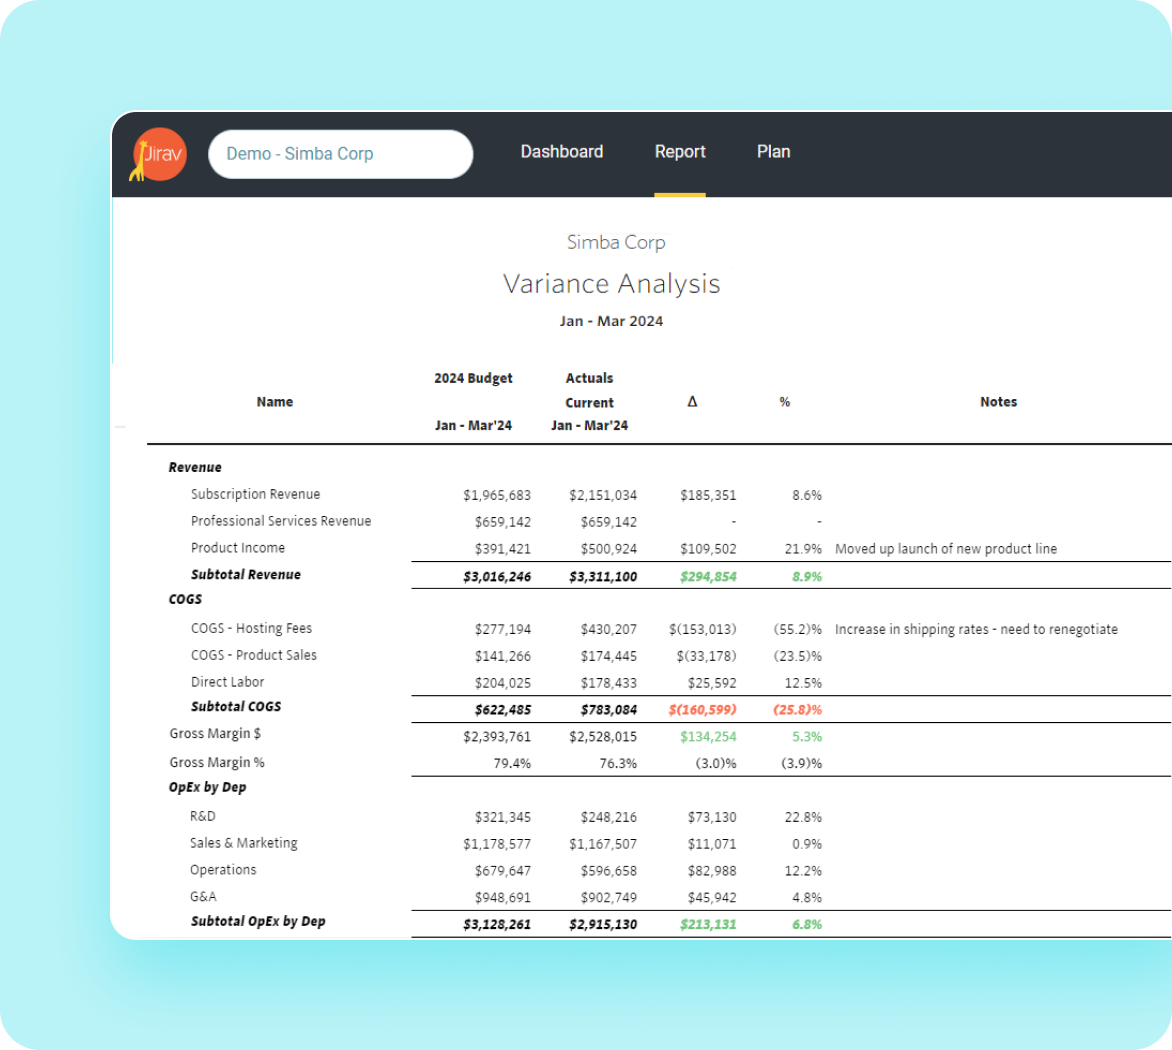
Unlike Excel and other solutions, Jirav makes it simple to view performance from one budget to the next or plan vs. actuals with easy-to-read variance reports. Add in-line commentary or footnotes so your clients can understand the meaning behind the numbers.
Compare multiple “what if” plans and highlight favorable vs. unfavorable scenarios all while taking into account working capital and cash flow impacts. Take your client services to the next level by providing prescriptive analytics rather than just an overview of past performance.
Compare multiple “what if” plans and highlight favorable vs. unfavorable scenarios all while taking into account working capital and cash flow impacts. Take your client services to the next level by providing prescriptive analytics rather than just an overview of past performance.
KPIs and Metrics
Analyze and provide data-driven insights
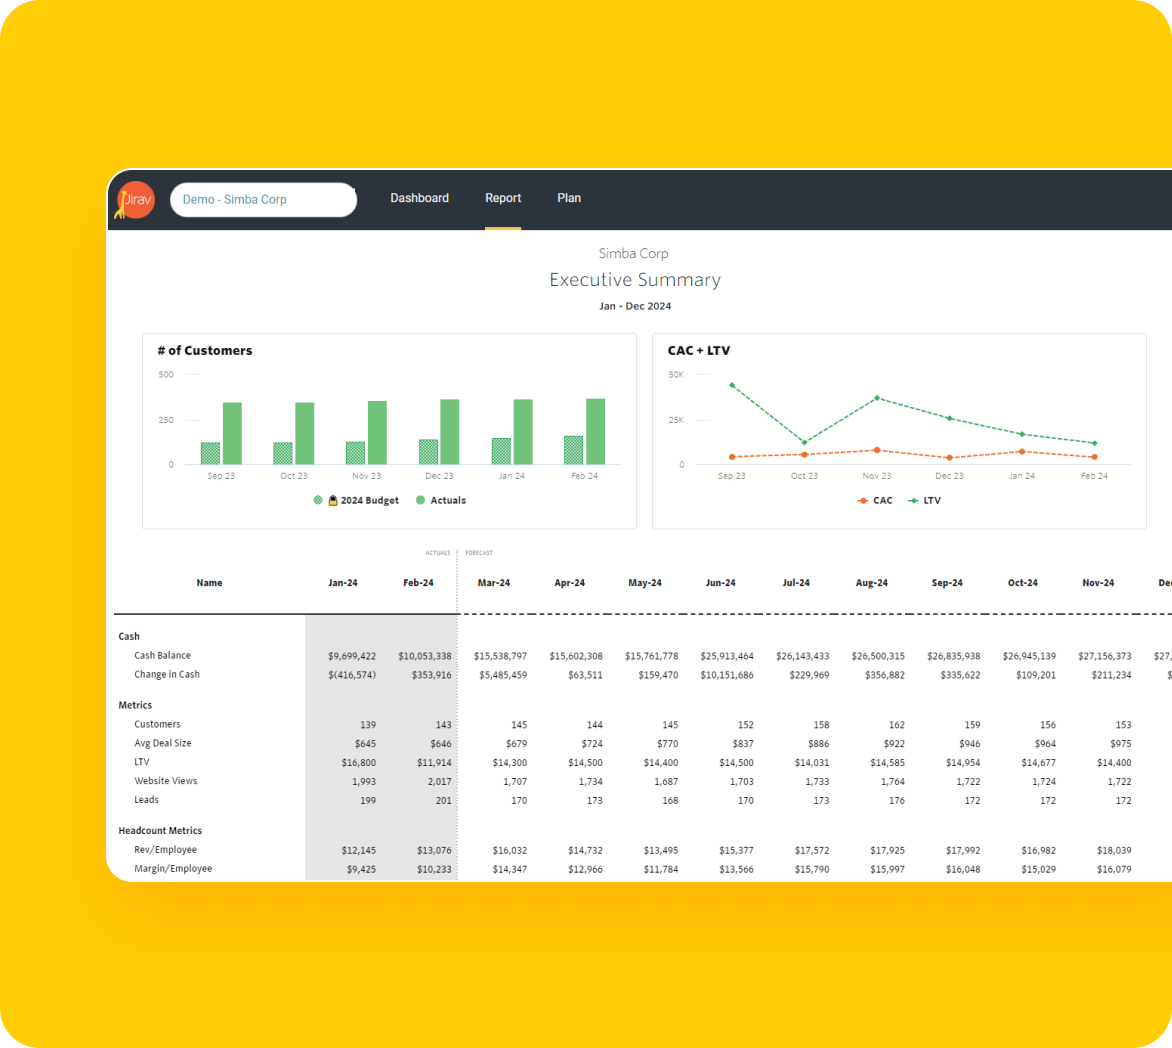
From cash runway to website views, Jirav streamlines calculations to create beautiful dashboards and reports for all your client's data, including industry-specific metrics. With our KPI Library, swiftly measure performance across various time periods and planning scenarios to drive effective client conversations.
Eliminate manual updates and outdated reports - our automation lets you concentrate on providing value-added services so that you grow firm revenue.
Eliminate manual updates and outdated reports - our automation lets you concentrate on providing value-added services so that you grow firm revenue.
Dashboard Visualizations
See the big picture at a glance
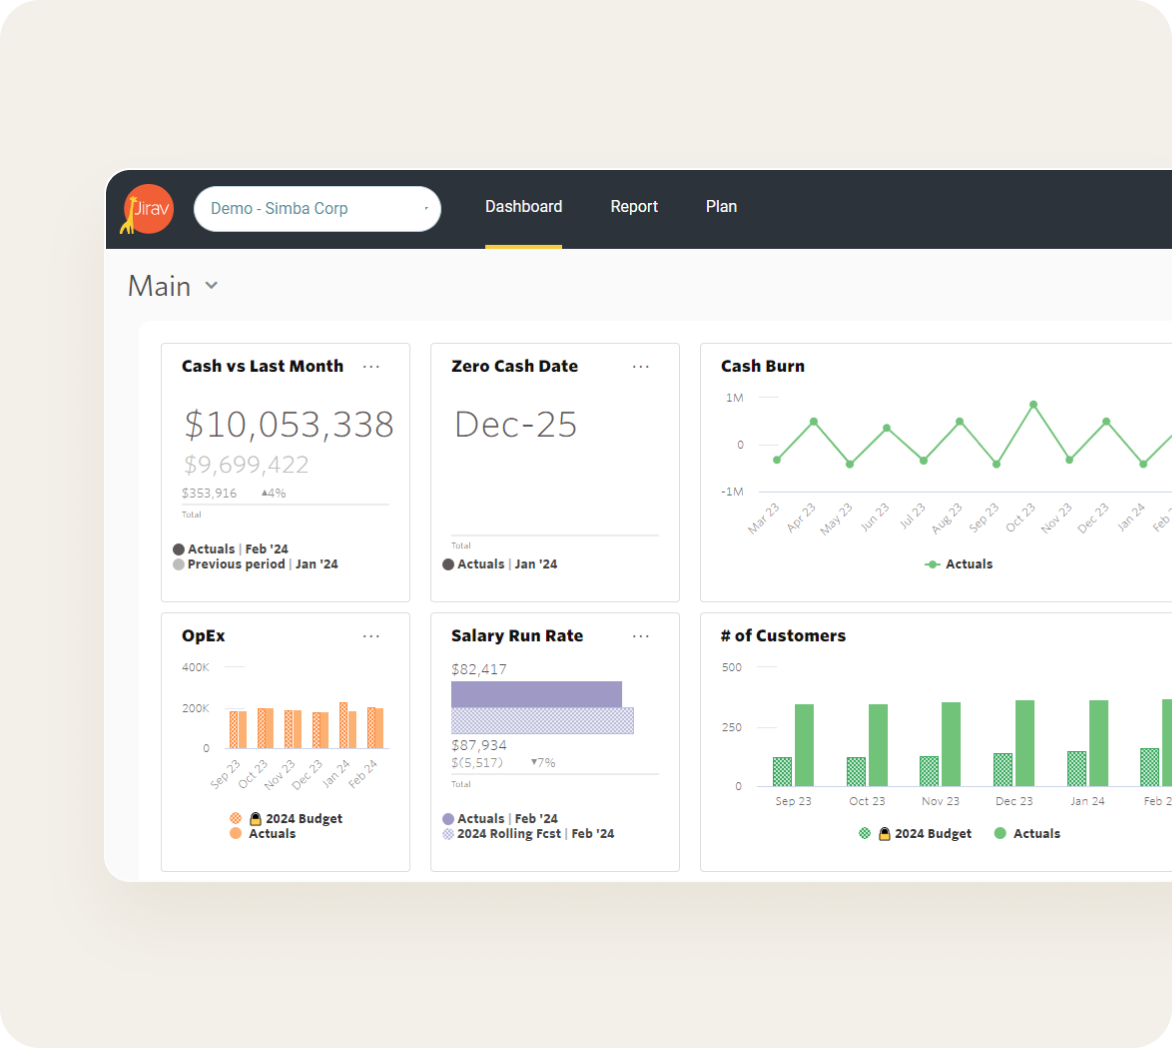
Understanding financial statements can be challenging for clients. With Jirav, simplify the process by presenting a comprehensive overview of their business through a user-friendly financial dashboard so that they can gain insights into historical performance and projected business activity in one glance.
Instantly compare planned versus actual results across all financial statements, access rolling forecasts, and communicate downstream effects. Utilize intuitive point-and-click data visualization tools to create and share dashboards, facilitating deeper client conversations and driving informed decision-making.
Instantly compare planned versus actual results across all financial statements, access rolling forecasts, and communicate downstream effects. Utilize intuitive point-and-click data visualization tools to create and share dashboards, facilitating deeper client conversations and driving informed decision-making.
Automated Client Deliverables
Share insights on performance and strategy
Package and automatically deliver monthly financial reports directly from Jirav — in just a few clicks. Save countless hours with reusable report packages, allowing you to customize once and reuse month after month. Channel your team's efforts on providing financial insights and guidance to your clients.
Jirav replaces spreadsheets for financial modeling, but we don’t lock you in. Easily consolidate and export information to Excel or Google Sheets for further analysis or sharing. You can also export reports as PDFs or share them directly online with a link for your clients to view and add commentary.
Jirav replaces spreadsheets for financial modeling, but we don’t lock you in. Easily consolidate and export information to Excel or Google Sheets for further analysis or sharing. You can also export reports as PDFs or share them directly online with a link for your clients to view and add commentary.
The whole system is polished, professional, and impressive. Now we’re giving clients executive reports with visuals showing cash, profitability, headcount and salary data if they want it – really zeroing in on what’s most important to them…We’re already much more of a partner for clients, rather than the people who just compile reports for them.
Cathy Becker,
CPA, CGMA, Senior Controller
AccountingDepartment.com
AccountingDepartment.com
Reporting and Dashboard Features

3 Way Financials
Instantly access an income statement, balance sheet, and cash flow statement when you connect your client's accounting data and then report on future activity as well.

Custom Reporting
Automate board reporting, investor packages, and key reports that can be tailored with custom time periods, colors, headers/footers, and commentary.

Dashboard Visualizations
Visualize data with customizable dashboards, incorporating both financial and non-financial metrics. Embed graphics to report packages for easier data comprehension.

COA Customization
Quickly customize the Chart of Accounts to match your client's reporting and planning requirements without changing the accounting system.

Industry Blueprints
Create and utilize best practice industry blueprints to streamline financial workflows, optimize proven expertise, and quickly onboard new clients.

KPI Library
Review out-of-the-box metrics for efficient performance measurement and decision-making. Plus, easily build standardized or personalized metrics tailored to your client's needs.

Budget vs Actuals
Monitor your clients' performance against targets in real-time and know immediately where discrepancies arise to provide concise and informed guidance.

Scenario Analysis
Easily compare multiple “what if” scenarios across all financials to accelerate decisions and pivot strategies when warranted.

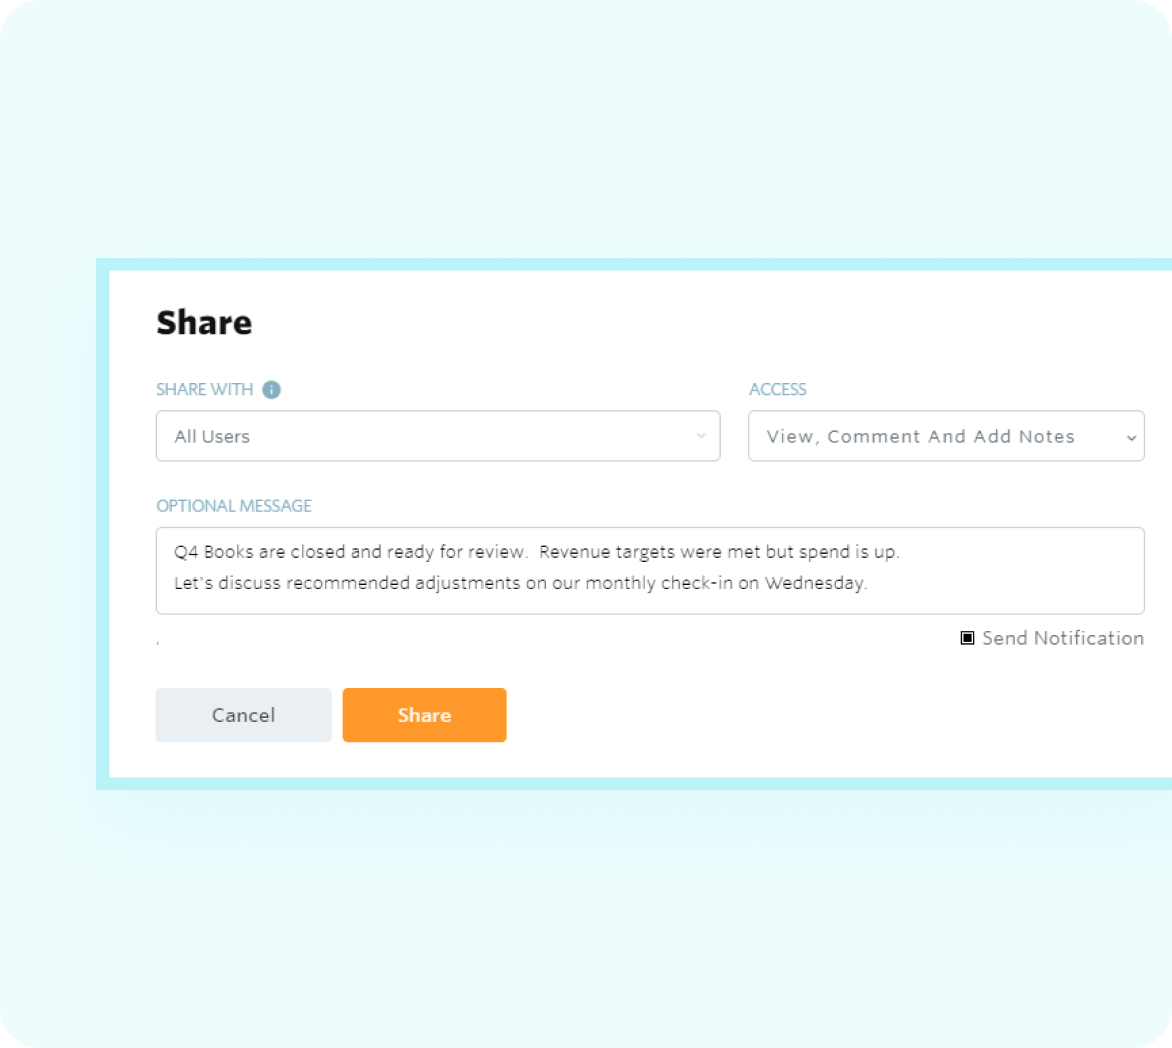
Collaboration
Dynamically share reports and dashboards with your clients and their key stakeholders. Allow them to ask questions and add commentary.