





What variance analysis is
Variance analysis is the process of comparing actual financial results to budget or forecast, isolating the cause of each material difference, and converting that cause into a decision or a model adjustment. A variance is favorable when it improves operating income (revenue above plan, expense below plan) and unfavorable when it reduces operating income. The analysis is not the comparison itself. It is the explanation of why the gap happened and what should change because of it.
Most finance teams produce the comparison every month. Far fewer produce the explanation. That distinction is the entire difference between a variance report that gets filed and a variance conversation that changes a hiring plan.
Variance reporting and variance analysis are different deliverables
A variance report displays plan, actual, and difference across the P&L. Producing one is a systems exercise: load the actuals, align the periods, render the columns. Any reasonably configured reporting layer does it.
Variance analysis asks a different question. Given that revenue came in $180,000 under plan, was that a pricing problem, a volume problem, a mix shift, or a timing slip? Each answer implies a different response, and three of the four imply that the forecast itself needs updating.
Jirav’s earlier treatment of budget versus actual reporting covers the comparison mechanics. This piece picks up where that leaves off, at the explanation.
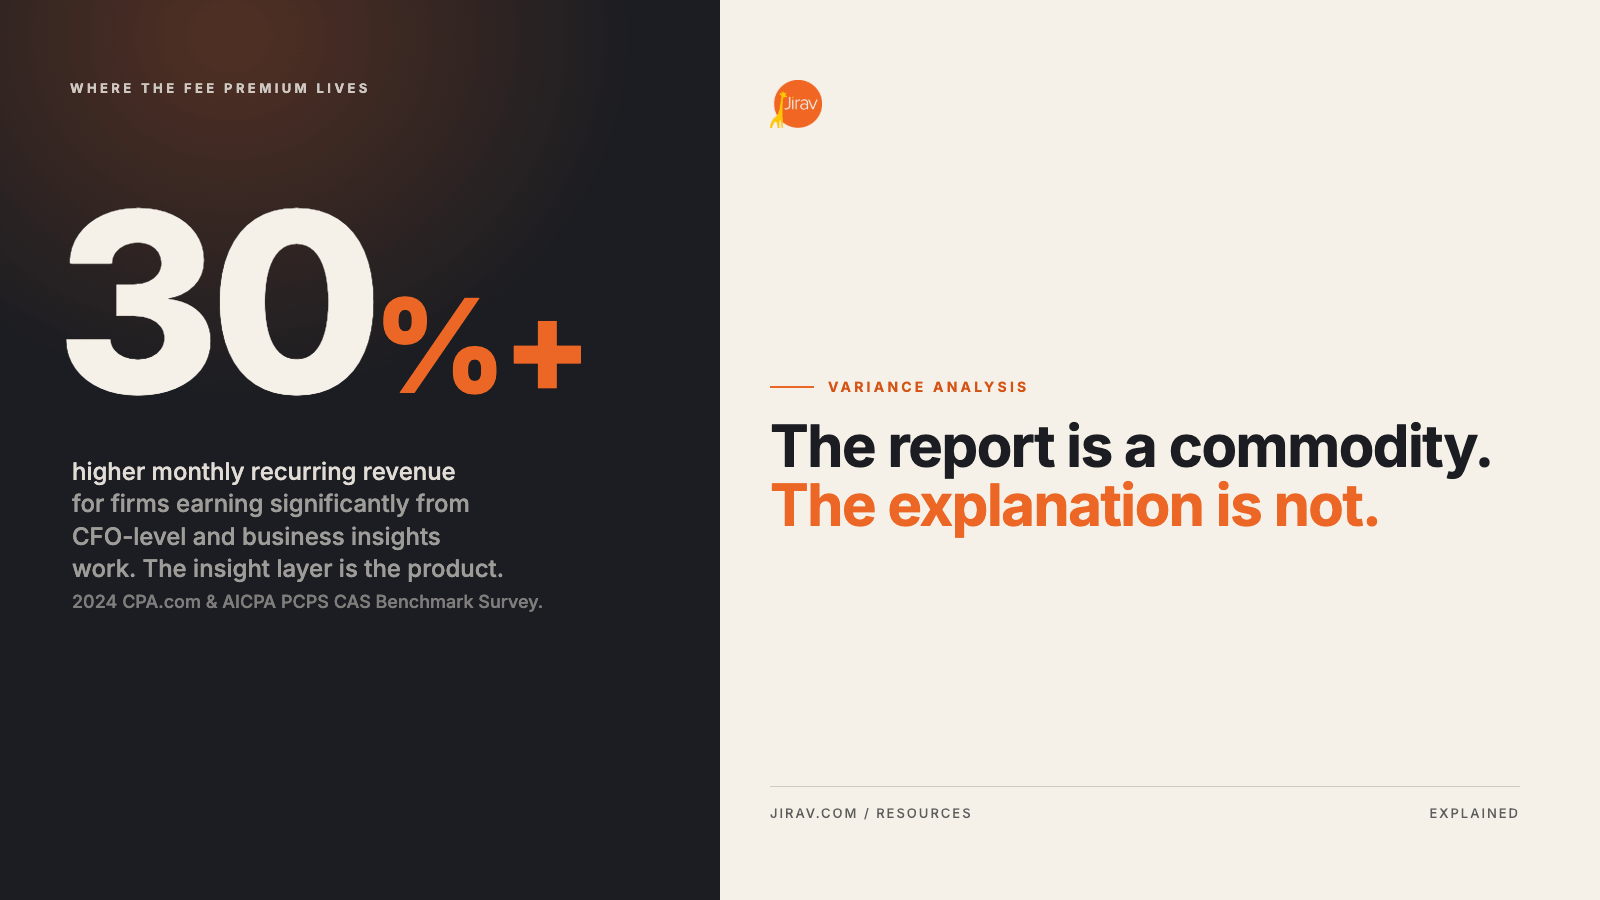
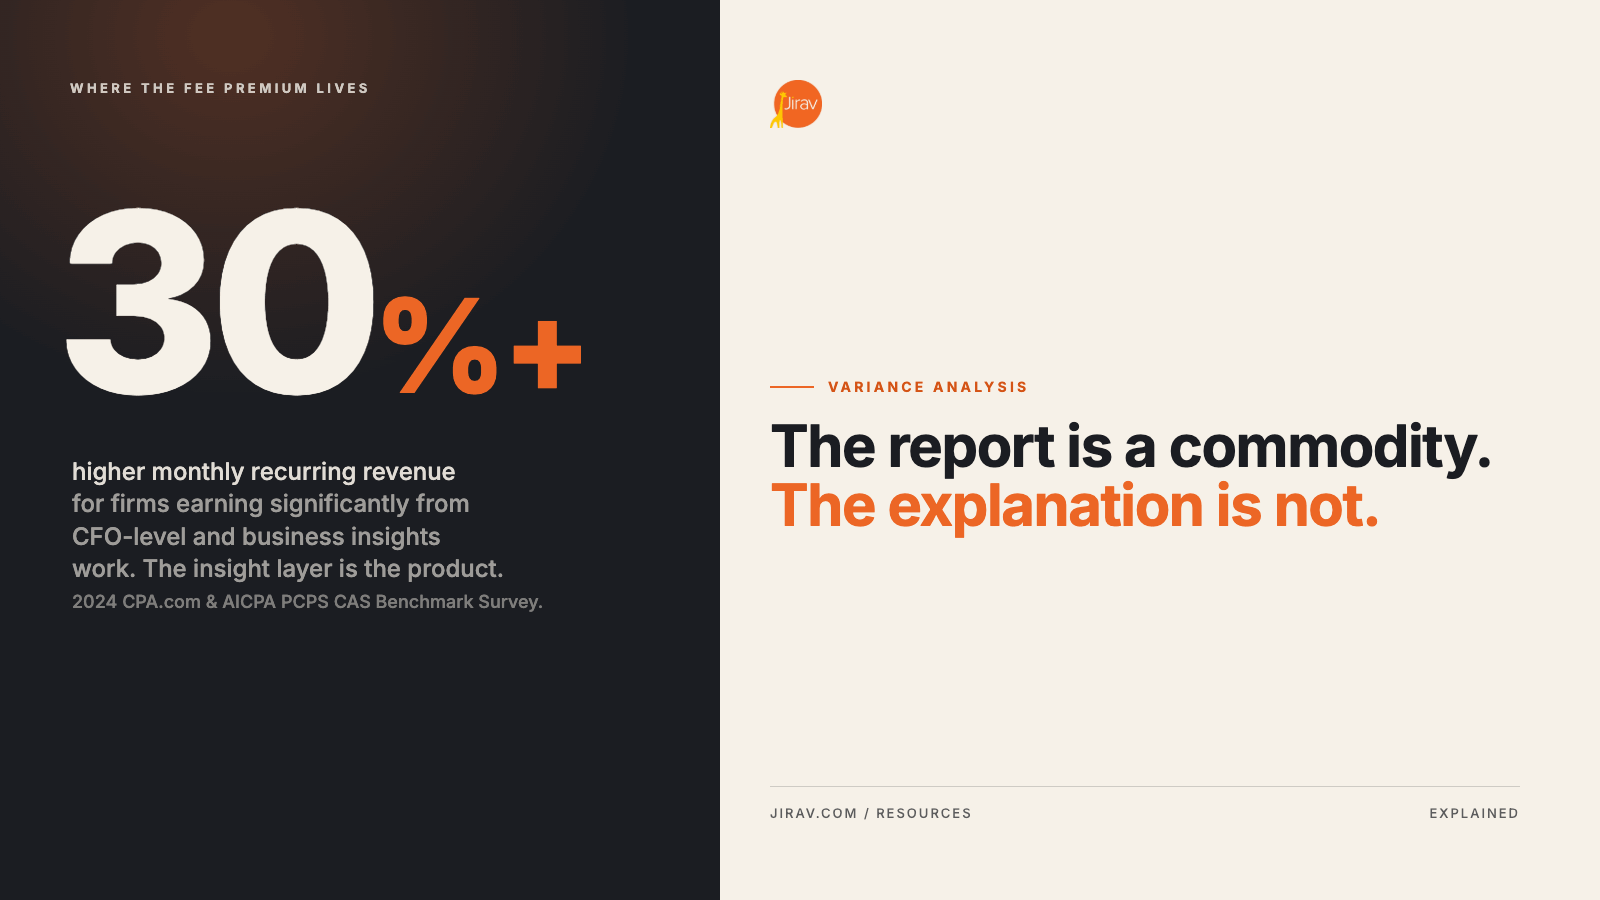
The practical consequence for advisory firms is a pricing one. The report is a commodity. The explanation is not. Data from the CPA.com and AICPA PCPS CAS Benchmark Survey supports this directly: the smaller group of firms generating significant revenue from CFO-level and business insights services reported more than 30% higher monthly recurring revenue and a typical monthly fee more than 30% higher than their peers. The insight layer is where the fee premium lives.
Foundation reading: If the budget and the forecast in your comparison are the same artifact, the variance is measuring against a stale target. Budget versus forecast covers why the two need to stay separate and what each one is for.
Decide what is material before you open the report
The most common failure in variance work is investigating everything, which means investigating nothing well. A month-end review with forty flagged lines produces a two-hour meeting and no decisions.
Set thresholds in advance, and set them on two dimensions rather than one. A percentage threshold alone flags a 40% swing on a $900 line item. A dollar threshold alone misses a 22% miss on a line that is small today and structural tomorrow. Require both:
|
Line type |
Suggested trigger |
Reasoning |
|---|---|---|
|
Revenue lines |
Greater than 5% and greater than $25K |
Revenue variances compound across the remaining forecast periods, so the bar is lower |
|
Direct cost / COGS |
Greater than 5% and greater than $25K |
Margin movement is the leading indicator most owners react to |
|
People cost |
Greater than 3% and greater than $15K |
Timing-driven and usually explainable in one sentence, but structural misses here repeat monthly |
|
Discretionary opex |
Greater than 10% and greater than $10K |
Noisy by nature; a higher bar prevents false positives |
|
Cash and working capital |
Any move outside the stated operating range |
Absolute position matters more than percentage change |
Calibrate the dollar figures to the client. The percentages hold across most sizes. Publish the thresholds in the engagement documentation so the client understands why a line was not discussed.
Decompose the variance before you explain it
A total variance is an aggregate of several independent movements, and explaining the aggregate is where most commentary goes wrong. Break it into components first.
Revenue: price, volume, and mix
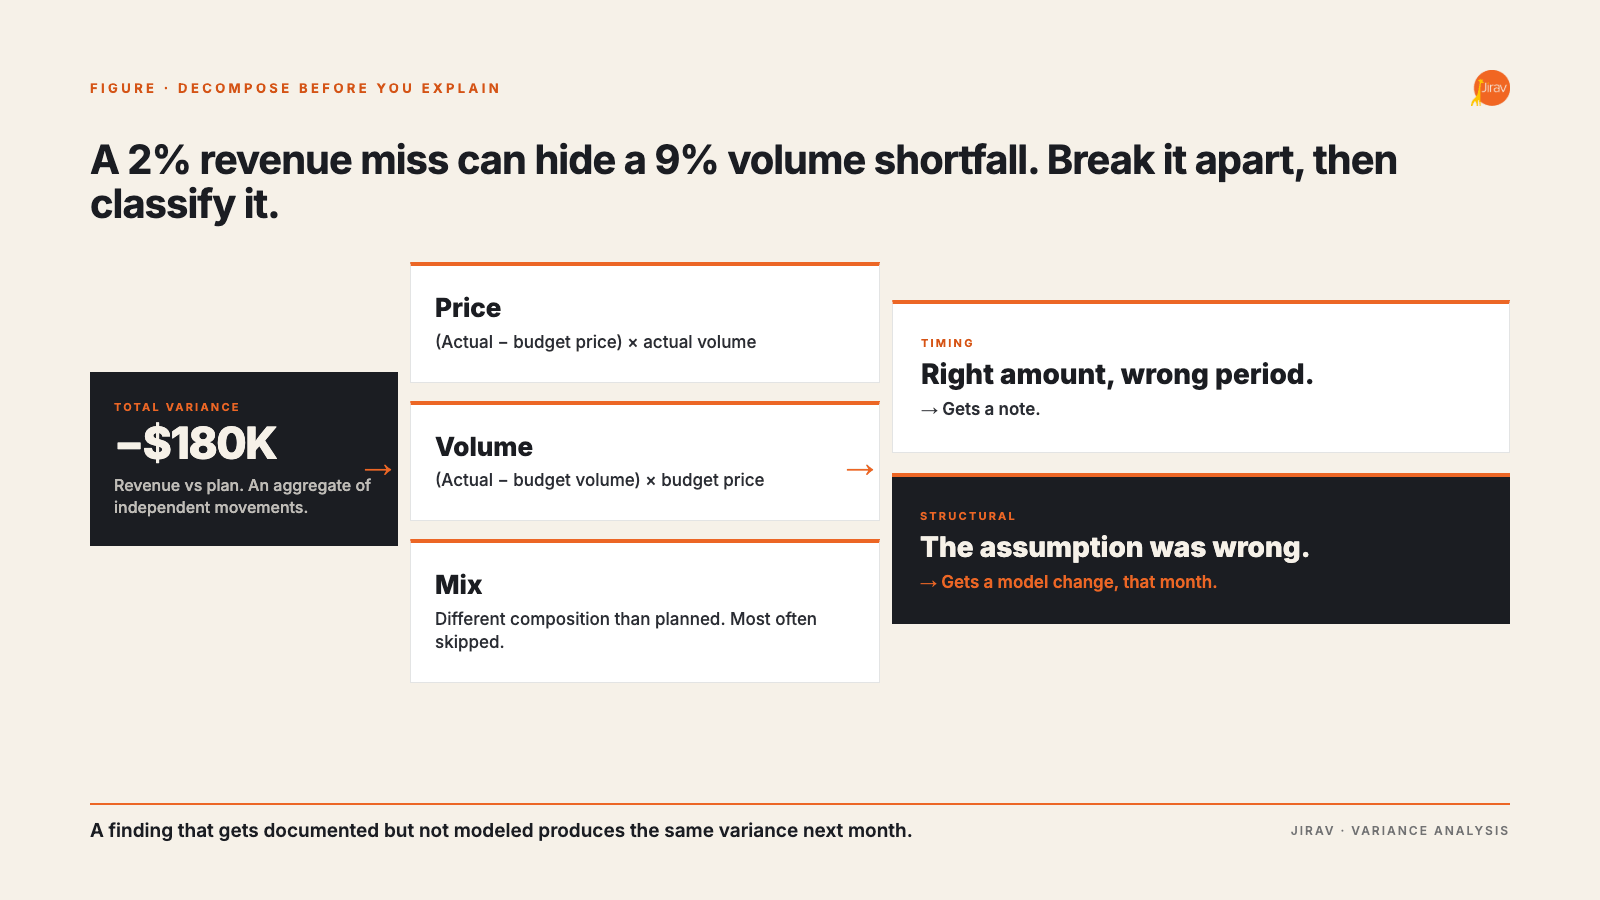
Three separate questions produce three separate numbers, and they frequently offset each other. A revenue line that comes in 2% under plan can be hiding a 9% volume shortfall partially covered by a favorable price variance, which is a very different situation from a flat 2% miss.
- Price variance equals (actual price minus budget price) times actual volume. Isolates realized pricing, discounting, and contract terms.
- Volume variance equals (actual volume minus budget volume) times budget price. Isolates demand and sales execution.
- Mix variance captures the effect of a different composition of products, services, or channels than planned, even when total volume lands on target.
Mix is the one most often skipped and most often material. A services firm that hits its total billable hours but delivers them through lower-level staff has a mix problem that shows up as a margin miss, not a revenue miss.
Expense: rate and usage
The same logic applies on the cost side. A materials overrun is either a rate problem (unit cost rose) or a usage problem (consumed more units than planned). A payroll overrun is either a rate problem (compensation above plan) or a headcount timing problem (hired earlier or in different roles than planned).
Timing versus structure
This is the single most useful classification, because it determines whether the forecast needs changing. A timing variance means the amount was right and the period was wrong, and the offsetting variance appears in a later month. A structural variance means the assumption itself was wrong and will keep producing misses until it is updated.
Label every material variance as one or the other. Timing variances get a note. Structural variances get a model change.
Write the explanation as a causal chain, not a restatement
Weak commentary restates the number in words. Strong commentary names the driver, the magnitude, the expected duration, and the action.
|
Restatement (weak) |
Analysis (useful) |
|---|---|
|
Revenue was $180K under budget for the month. |
Revenue missed by $180K: $220K unfavorable volume from six enterprise deals slipping past month end, partially offset by $40K favorable price from lower discounting. Four of the six closed in the first week of the following month, so roughly $150K is timing. The remaining $30K reflects a close rate running at 18% against a 25% assumption, which is structural and the driver has been updated. |
|
Payroll was over plan by $62K. |
Payroll exceeded plan by $62K: two engineering hires started in week two rather than the planned month-three date, adding $48K, and the benefits loading factor ran at 24% against a 19% assumption, adding $14K. The hires are a pull-forward, so the full-year number is unchanged. The loading factor is structural and has been corrected in the model. |
|
Gross margin declined 310 basis points. |
Gross margin fell 310 basis points on a service mix shift: implementation work ran at 38% of revenue against a 25% plan, and it carries a 22-point lower margin than recurring work. Volume and pricing were both on plan. If the current implementation backlog holds, margin stays compressed for two more quarters, and the mix assumption in the model has been adjusted accordingly. |
The pattern is consistent: cause, quantified components, expected duration, model consequence. Three to five sentences per material variance is usually enough. Anything longer is a memo, not commentary.
For the delivery mechanics of the report those explanations sit inside, Jirav has covered five keys to a meaningful variance report and how to get more value out of the variance report itself.
Close the loop back into the model
Variance analysis that ends at the commentary is a reporting exercise wearing an analysis label. The loop closes when structural findings change the drivers.
A workable monthly sequence:
- Load actuals and generate the comparison against both the original budget and the current forecast. Two baselines answer two different questions: how the year is tracking against commitment, and how the year is tracking against current expectation.
- Apply thresholds and produce the exception list. Everything below threshold is acknowledged as immaterial and skipped.
- Decompose each exception into its components and label it timing or structural.
- Update the drivers for every structural finding, in the model, that month. Not at quarter end.
- Re-run the remaining forecast periods and note what moved. If a close rate correction pushes the year-end cash balance below the operating floor, that is the headline, not the original variance.
- Deliver commentary plus the revised outlook together. The revised outlook is the part the client acts on.
Step four is where most processes break. A finding that gets documented but not modeled produces the same variance next month, and repeat variances erode the credibility of the whole package.
Why the loop breaks, and what fixes it
The bottleneck is rarely analytical skill. It is the gap between where the reporting lives and where the model lives. In most stacks those are two different artifacts, often two different tools, and the update in step four means manually re-entering a changed assumption into a spreadsheet that was last touched at budget time.
That gap is measurable. AFP’s benchmarking work found finance professionals naming data problems ahead of skills or tools as the main obstacle to technology success, with 61% citing a lack of data reliability and 60% citing a lack of accessible data. Across a book of fifteen clients, the friction multiplies until the monthly process degrades to whatever fits in the available hours, which is the report without the analysis.
Jirav is built around the assumption that reporting and planning are the same system rather than adjacent ones. Actuals connect from the general ledger, payroll, and operational sources, so the comparison is generated rather than assembled. Because the plan is a driver-based model rather than a static budget file, a structural finding gets applied as a driver change and the remaining periods recalculate immediately, including the balance sheet and cash flow effects. Commentary lives with the report, and the partner console lets a firm apply the same variance package and reporting across an entire client book instead of rebuilding it per engagement.
The method above works in a spreadsheet. It works at fifteen clients only if the loop between report and model takes minutes rather than an afternoon.
Four mistakes that show up repeatedly
- Comparing only to original budget. By month eight, the original budget is a historical document. Comparing to both budget and current forecast is the only way to separate "we committed to the wrong number" from "we are missing our current expectation."
- Netting variances at the category level. A $40K favorable and a $45K unfavorable inside the same rollup net to $5K and look quiet. Analyze at the level where the driver operates.
- Treating favorable variances as good news. Revenue above plan on a single unrepeatable deal, or expense below plan because a critical hire did not happen, are both warnings. Favorable is a direction, not a verdict.
- Publishing without the balance sheet. A P&L-only variance review misses collection deterioration entirely. Receivables can stretch by twenty days with no visible P&L effect and a serious cash effect.
Common questions
What is the difference between a favorable and an unfavorable variance?
A favorable variance improves operating income relative to plan: revenue above budget, or expense below budget. An unfavorable variance reduces it: revenue below budget, or expense above budget. The labels describe direction against plan and carry no judgment about whether the outcome is desirable. Expense running below plan because a planned hire was never made is favorable and usually bad.
How often should variance analysis be performed?
Monthly, tied to the close, for the full P&L and the key balance sheet accounts. Weekly for cash where the position is tight. Quarterly is too slow to be corrective: by the time a structural driver error surfaces, it has already produced a full quarter of compounding misses.
What variances should be included in a board or lender package?
Material variances only, with causal explanations, plus the revised outlook that results from them. A board package with every line above and below plan is a data dump. The board reporting structure that works keeps variance commentary to the exceptions and spends the space on what changed in the forecast. A KPI dashboard carries the operational detail underneath it.
|
Close the loop between variance and forecast Jirav connects reporting and driver-based planning in one system, so a structural finding updates the model and the revised outlook in the same session.
|