


The financial model you build for a seed-stage client is not a smaller version of the model you build at Series B. It answers a different question, it is read by different people, and it fails in different ways. Advisory firms that treat the startup model as a single artifact that just accumulates rows over time end up rebuilding it from scratch at every round, usually under deadline pressure, and usually in the middle of diligence.
The bar has moved, and the model has to move with it. Carta’s data on seed cohorts shows that in a more typical year like 2018, roughly 25 to 30 percent of companies that raised a seed round went on to raise a Series A within 24 months. For the 2022 cohort, only about 17 percent reached a Series A in their first two years.
That gap is not a modeling problem. But it does change the job the model has to do. When capital was cheap, the model was a growth narrative with a cash schedule attached. Now it is a survival argument that has to hold up against a diligence process which assumes every number is optimistic until the underlying driver is shown. Here is how the model’s job changes across the three rounds, and what to standardize so one structure carries a client through all of them.
What actually changes between stages
Three-statement output does not change. It is the floor at every stage, and a client who cannot produce a forecasted balance sheet and cash flow statement alongside the P&L is not ready for any conversation with an institutional investor. If that layer is not solid, start with 3-statement financial models before anything else.
What changes is the driver layer underneath the statements, and specifically where the model’s center of gravity sits.
|
Stage |
Question the model answers |
Center of gravity |
|---|---|---|
|
Seed |
How long do we have, and what does the next milestone cost? |
Headcount and cash |
|
Series A |
Is the growth repeatable, and does it pay for itself? |
Unit economics and cohorts |
|
Series B |
Can capital be allocated across departments and defended? |
Departmental plan and variance |
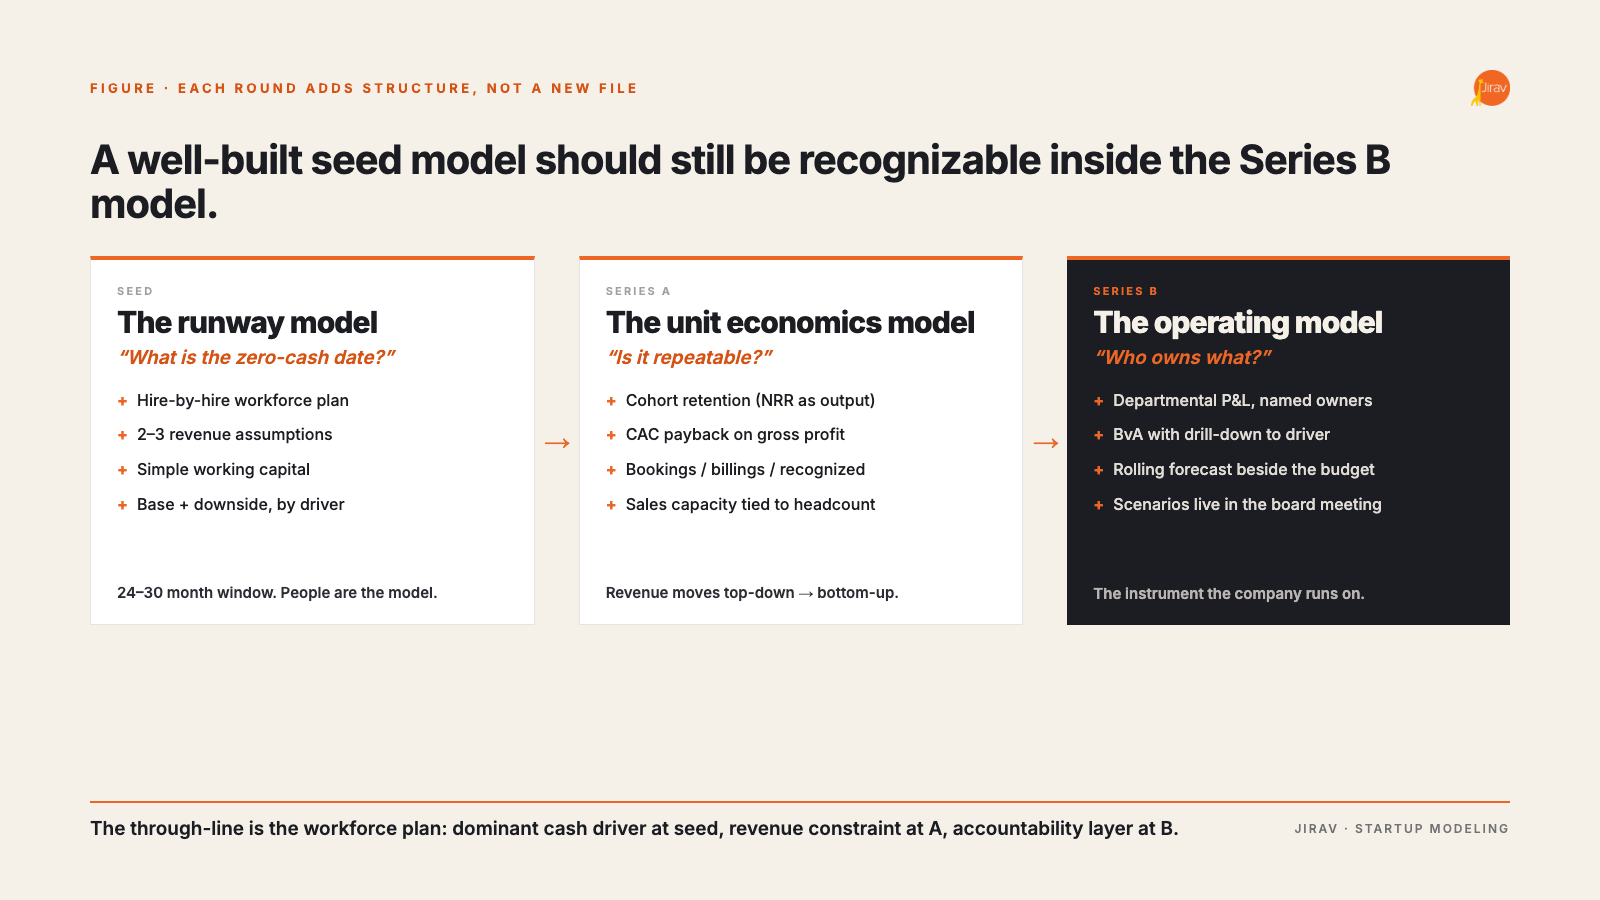
Each shift adds structure rather than replacing it. A well-built seed model should still be recognizable inside the Series B model. That is the standard worth holding, and it is the one most spreadsheet-based models fail.
Seed: the runway model
At seed the model exists to answer one question with precision: what is the zero-cash date under a plan the founders will actually execute, and what does the milestone that unlocks the next round cost to reach?
Structurally that means a short driver list, monthly granularity, and a forward window of 24 to 30 months. The instinct to plan for 18 months of runway is outdated. The gap between primary rounds has stretched well past two years, so a model that runs out of forward periods before the client runs out of cash is not doing its job.
The most common mistake at this stage is misallocated detail. Advisors build an elaborate revenue build for a company with eleven customers and then model headcount as a single growing expense line. That is backwards. At seed, people are the model. Salary, timing of each hire, employer burden, and the lag between offer and first full-cost month drive the cash curve more than revenue does.
What a seed model should contain:
- A hire-by-hire workforce plan with start dates, fully loaded cost, and department tags that will survive later restructuring
- Revenue driven by two or three assumptions, not twenty. Pipeline conversion, average contract value, and ramp are usually enough
- Working capital assumptions that are simple but present: collection days, payment days, and any deferred revenue treatment
- A base case and a downside case, each producing an explicit zero-cash date, with the downside built by moving drivers rather than by editing outputs
The scenario discipline matters more than the scenario count. Founders will ask what happens if the round takes six months longer than planned. If the answer requires an afternoon of spreadsheet surgery, the model is not built correctly. Scenarios should be a property of the model, not a copy of it. Our guide to scenario planning for finance teams covers the mechanics in more depth.
Series A: the unit economics model
At Series A the question shifts from survival to repeatability. Investors are underwriting a claim that the company can put a dollar into acquisition and get a predictable, improving return out. The model has to make that claim testable.
That means revenue moves from top-down assumption to bottom-up build. New logos come from a funnel with stage conversion. Expansion and contraction come from cohort behavior rather than a blended retention percentage. Gross margin gets split by revenue line, because a company blending subscription revenue with services at a single margin is hiding the answer to the question the investor is actually asking.
The benchmark context is worth having in the room. SaaS Capital’s 2026 survey of more than 1,000 private B2B SaaS companies puts the median growth rate at 22 percent, down from 25 percent the prior year. Equity-backed companies came in at 25 percent and bootstrapped companies at 20 percent. A client modeling 90 percent growth is not automatically wrong, but the model should be able to show which drivers produce that number and what each one implies about hiring, spend, and cash.
New structure that has to appear at this stage:
- Cohort-based retention feeding expansion and churn separately, so net revenue retention is an output rather than an input
- Acquisition cost by channel with payback calculated from gross profit, not revenue
- Deferred revenue and accounts receivable modeled properly, because the difference between bookings, billings, and recognized revenue becomes a diligence question rather than an accounting footnote
- Sales capacity tied to the workforce plan, so a revenue target that requires eleven more reps shows the eleven reps and their cost
For SaaS clients specifically, the metric set and model structure are covered in detail in our guide to FP&A for SaaS companies.
Series B: the operating model
By Series B the model stops being primarily an external document. It becomes the instrument the company runs on. Department heads own lines in it. The board reviews performance against it. Compensation may be tied to it.
This is the stage where the model has to support allocation and accountability at the same time. That requires departmental structure that holds: a marketing budget owned by marketing, an R&D budget owned by engineering, and a variance report each month that tells the owner what moved and why.
Spend discipline becomes measurable here. SaaS Capital’s 2026 spending benchmarks put total median department spend at 101 percent of ARR for equity-backed companies against 96 percent for bootstrapped ones, with a median of 22 percent of ARR on R&D and 15 percent on general and administrative costs. Those figures give a client’s department heads something to argue against, which is the point of a budget at this stage.
What has to be true of a Series B model:
- Departmental P&L with a named owner per cost center, and a plan that owner has seen and agreed to
- Monthly budget versus actual with drill-down to the driver, not just the variance amount
- A rolling forecast running alongside the fixed annual budget, so the board sees both the commitment and the current expectation
- Scenario capability that survives contact with a real board meeting, meaning a scenario can be built and shown in the meeting rather than promised for follow-up
The last point is where most models get exposed. A board asks what a 20 percent hiring freeze does to the zero-cash date and to the annual revenue target. In a properly structured model that is a driver change with an immediate three-statement result. In a spreadsheet it is a promise to circle back.
Why models get rebuilt, and what it costs
Every rebuild loses something. Assumption history disappears, so nobody can reconstruct why the previous plan was wrong. Actuals stop reconciling to the version of the model the board approved. The chart of accounts mapping gets redone, often differently, so year-over-year comparisons quietly break.
The rebuild is usually triggered by one of four things: departmental structure the original file cannot support, a workforce plan that outgrew its tab, a scenario request that would require duplicating the workbook, or a new controller who cannot follow the formula logic and does not trust it. All four are structural, and none of them are solved by a more careful spreadsheet.
This is the practical case for treating the model as a system rather than a file. The structure needs to absorb new drivers, new departments, and new scenarios without a migration event at every round.
Where a purpose-built platform changes the work
Jirav was built around driver-based modeling rather than reporting, which is the distinction that matters for this use case. Reporting tools describe what happened. A model has to answer what happens next when a driver moves, and it has to answer it across all three statements at once.
For advisory firms running a book of venture-backed clients, three things do most of the work. Workforce planning is native, so a hire-by-hire plan with start dates and loaded cost feeds the P&L, the balance sheet, and cash without a separate headcount file. Scenarios are a property of the model rather than a duplicate of it, so a downside case is built by changing drivers and can be shown side by side in a board meeting. And three-statement output is generated rather than assembled, so the balance sheet and cash flow statement stay tied to the revenue and hiring assumptions instead of drifting from them.
Auto Forecast is useful as a starting point at seed and early Series A, generating a baseline from historical results and seasonal patterns that the advisor then shapes with real drivers. It is a way to get the conversation started with a founder rather than a substitute for the judgment that follows. Firm examples of this work are collected in the advisory firm case studies, and the SaaS solution page covers the template and metric layer for recurring revenue clients.
The through-line: workforce planning
If there is one component that has to be right at every stage, it is the workforce plan. At seed it is the dominant driver of cash. At Series A it is the constraint on the revenue plan, because a sales number implies a capacity number. At Series B it is the accountability layer, because department budgets are mostly people budgets.
Build it once, correctly, with hire-level detail and department tags that will still make sense after two reorganizations. A workforce plan that has to be rebuilt at each round is the single most reliable predictor that the whole model will be rebuilt too.
What advisory firms should standardize
The economics of serving venture-backed clients only work if the second client costs meaningfully less to onboard than the first. That requires deciding once, at the firm level, what a startup model looks like.
- A single chart of accounts mapping approach applied across the client base, so reporting and variance analysis are comparable
- One workforce plan structure, with the same fields and the same department taxonomy for every client
- A defined scenario set that every client gets by default: base, downside, and a fundraise-delay case
- A fixed monthly cadence that produces a rolling forecast alongside budget versus actual, so the client conversation is about the forward view rather than a post-mortem
- A documented set of diligence-ready outputs, so a data room request does not become a two-week project
The firms that scale this practice are not the ones with the most sophisticated single model. They are the ones whose seventh startup client looks structurally identical to their first, which means the staff-level work is repeatable and the partner-level time goes into judgment rather than file archaeology.
The short version
Seed models are cash and headcount. Series A models are unit economics and cohorts. Series B models are departmental allocation and variance. The same underlying structure should carry all three, with detail added rather than the model replaced. When the model gets rebuilt at every round, the cost is not the rebuild itself. It is the loss of the history that would have told the client which assumptions they consistently get wrong.
|
See how advisory firms model venture-backed clients in Jirav Driver-based three-statement modeling, native workforce planning, and scenarios you can build live in a board meeting. Built for firms managing a book of clients, not a single spreadsheet. |