Build Confidence with Jirav’s Dashboards & Reporting Packages

Financial and Management Reporting
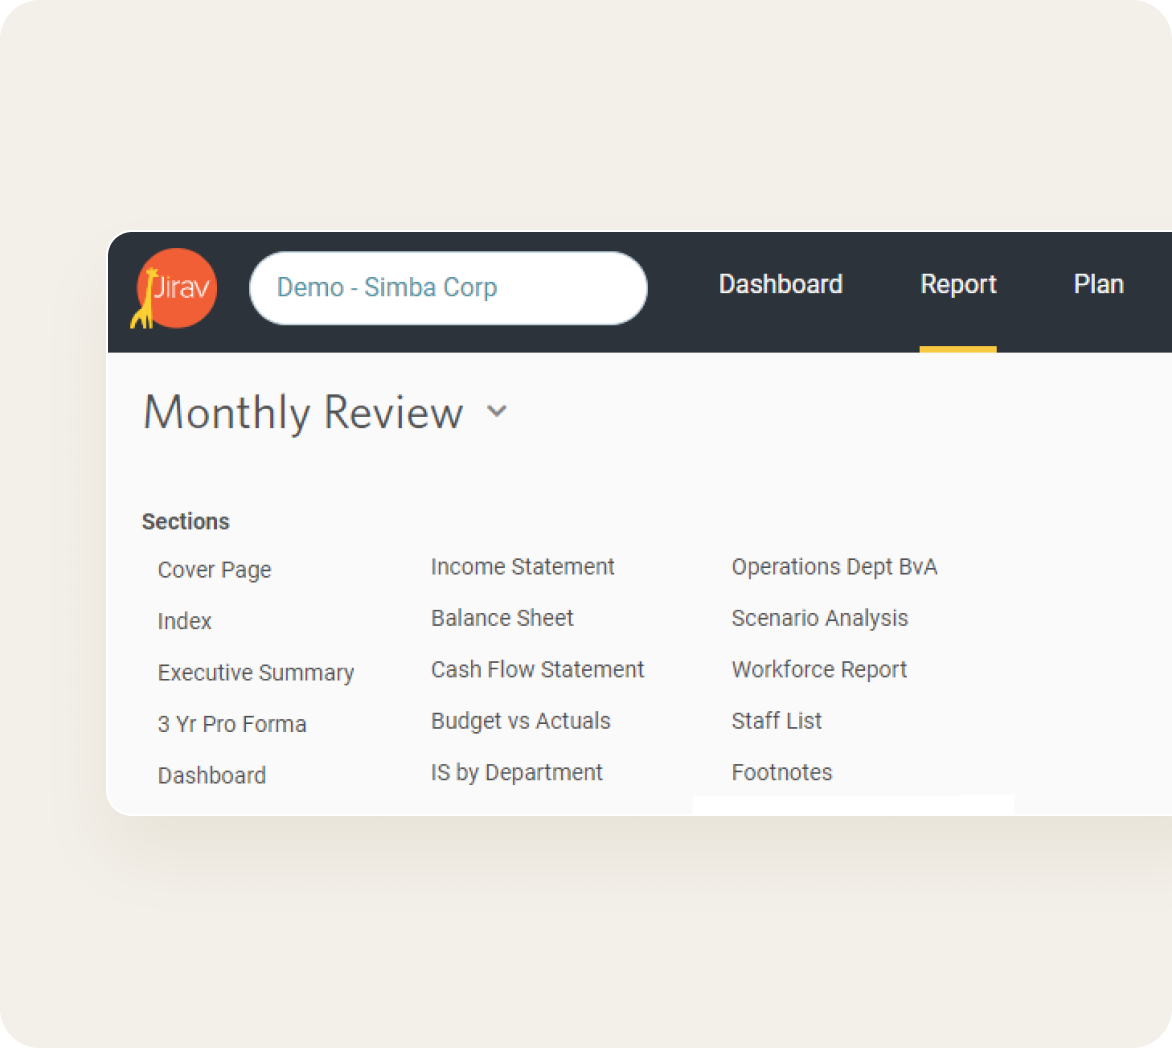
Generate beautiful, interactive reports and dashboardsJirav’s pre-designed templates include customizable 3-way financials as well as reports that can be created from scratch to fit your unique requirements. Get peace of mind with accurate real-time data.
Budget vs Actuals and Scenario Analysis
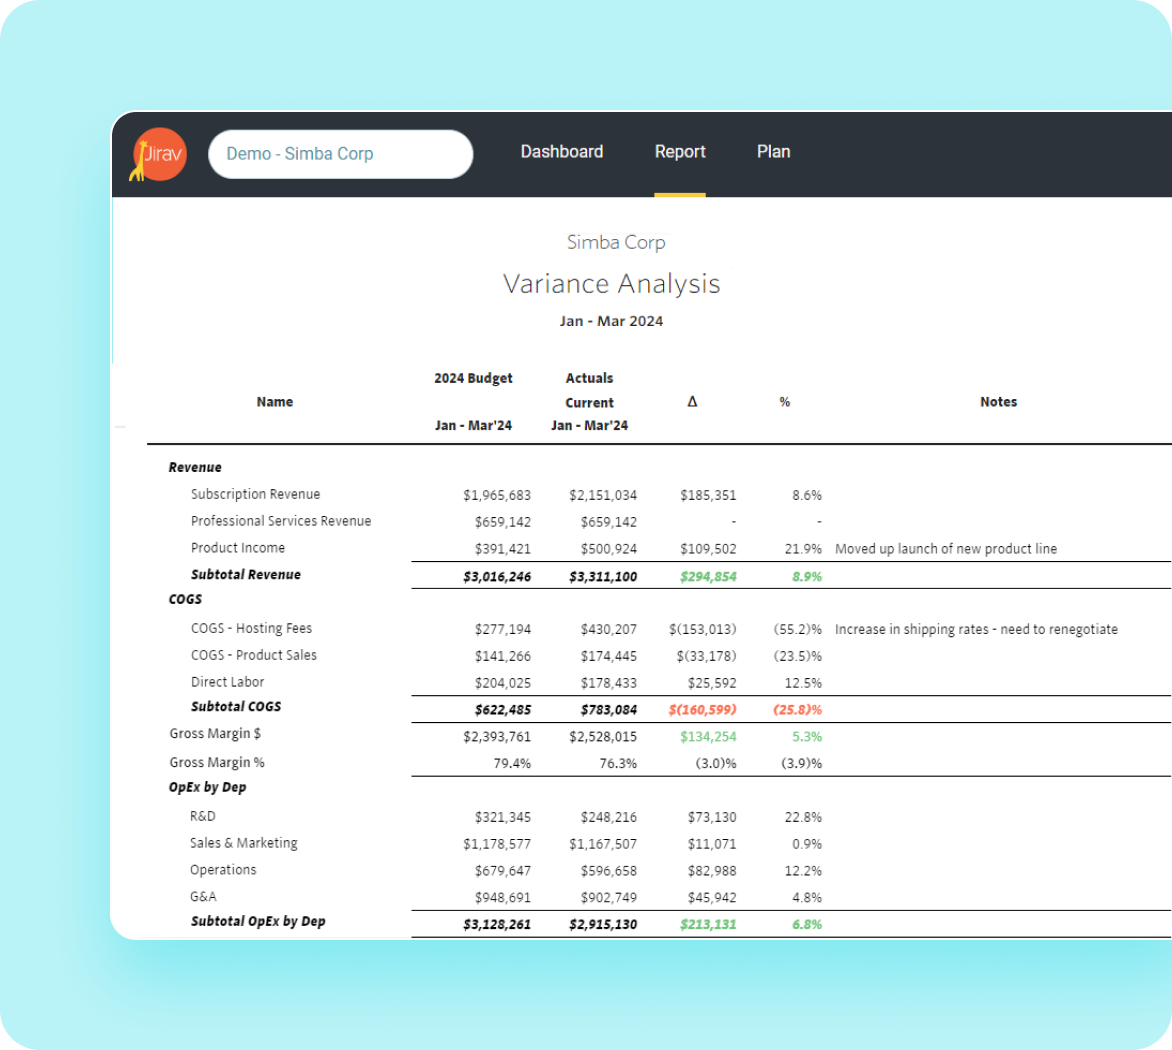
Perform easy side-by-side comparisonsCompare multiple “what if” plans and highlight favorable vs. unfavorable scenarios all while taking into account working capital and cash flow impacts. Concentrate on the critical areas of the business to accelerate decisions and pivot strategies when warranted.
KPIs and Metrics
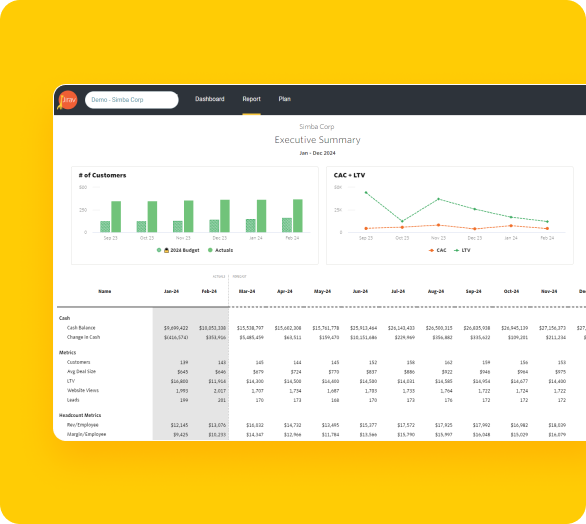
Analyze and provide data-driven insightsFrom cash runway to website views, Jirav streamlines calculations to create beautiful dashboards and reports for all your data, including industry-specific metrics. Eliminate manual updates and outdated reports - our automation lets you concentrate on your next steps. With our KPI Library, swiftly measure performance across various time periods and planning scenarios, delivering fast time-to-value tailored to your company's needs.
Never be caught off guard again. Have all the necessary data readily available to explain why and how.
Dashboard Visualizations
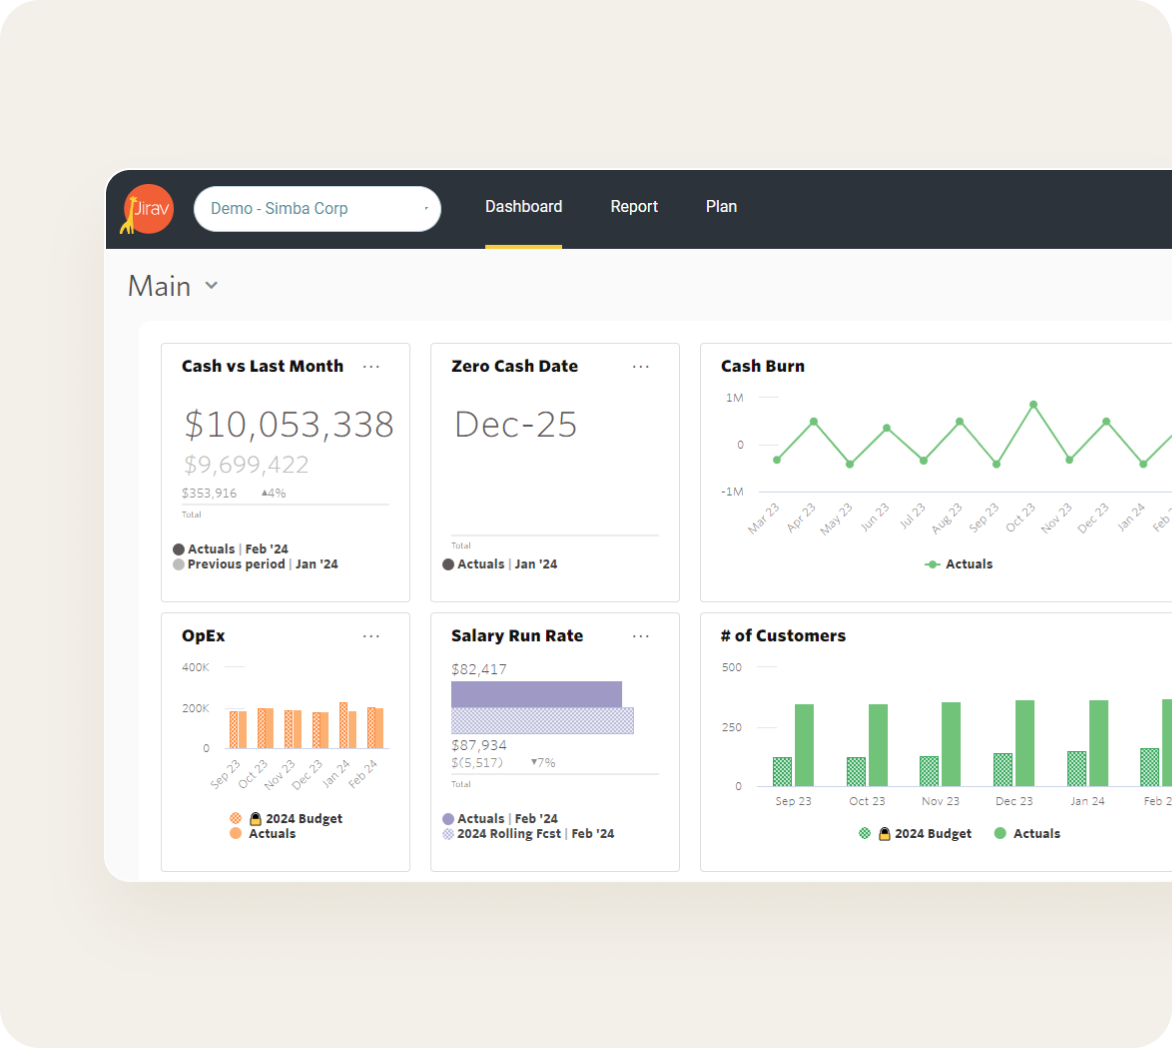
See the big picture at a glanceInstantly compare planned versus actual results, access rolling forecasts, and understand downstream effects. Utilize intuitive point-and-click visualization tools to create and share dashboards, facilitating rapid and informed decision-making.
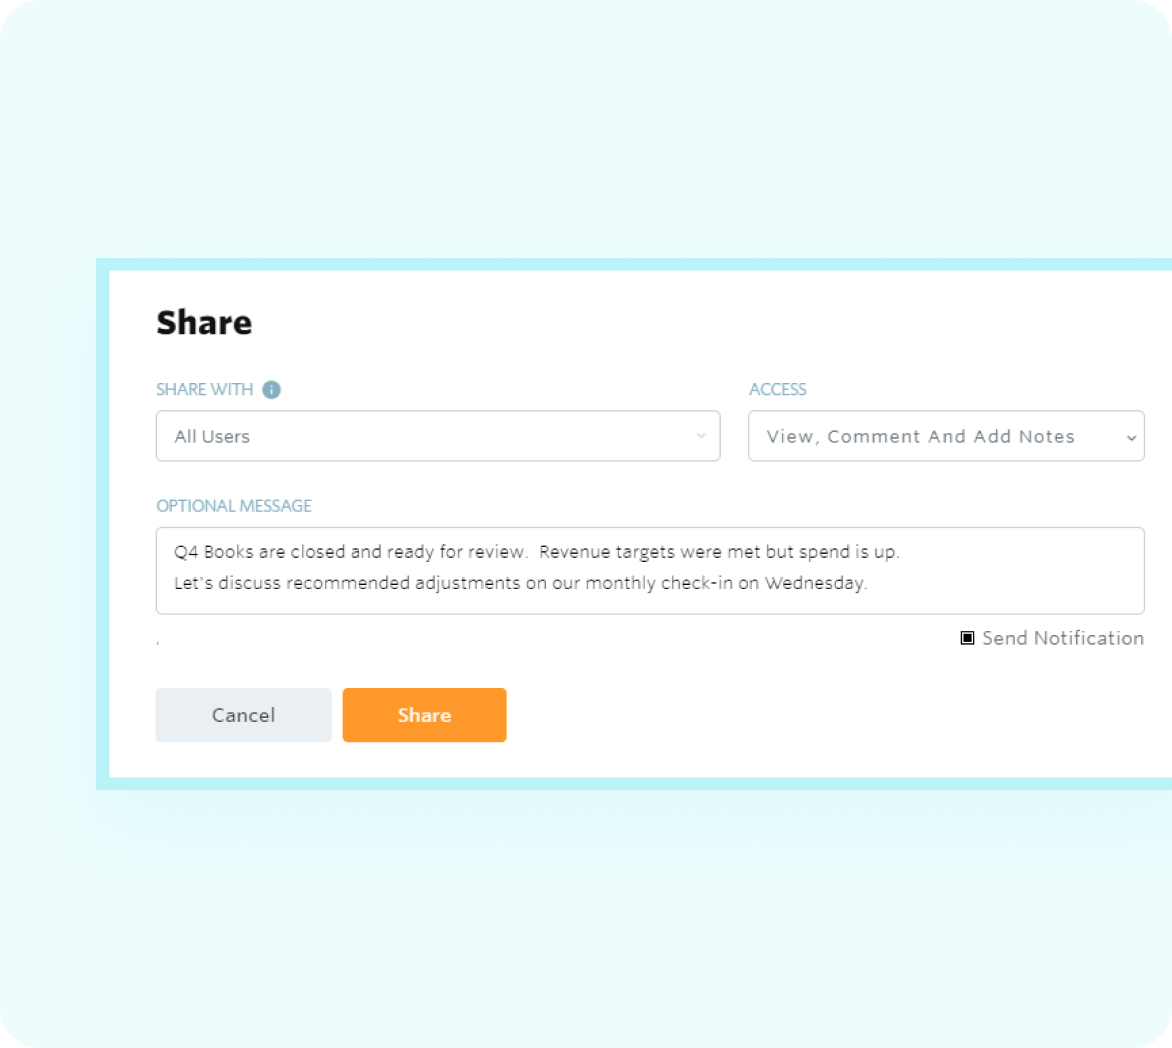
Share Reports & Dashboards with Stakeholders
Share insights on performance and strategyDeliver monthly financial reports directly from Jirav. Get the right info to the right person at the right time — in just a few clicks. Save countless hours with reusable report packages, allowing you to customize once and reuse month after month.
Jirav replaces spreadsheets for financial modeling, but we don’t lock you in. Easily consolidate and export information to Excel or Google Sheets for further analysis or sharing. You can also export reports as PDFs or share them directly online with a link for others to view and add commentary.
We used to spend hours generating financial statements from QuickBooks, then formatting and reviewing them. Now with Jirav I can do it in seconds.
ComplianceQuest
Reporting and Dashboard Features


Review out-of-the-box metrics for efficient performance measurement and decision-making. Plus, easily build standardized or personalized metrics tailored to your company's needs.

Monitor your performance against targets in real-time and know immediately where discrepancies arise to drive informed changes.

Easily compare multiple “what if” scenarios across all financials to accelerate decisions and pivot strategies when warranted.
