


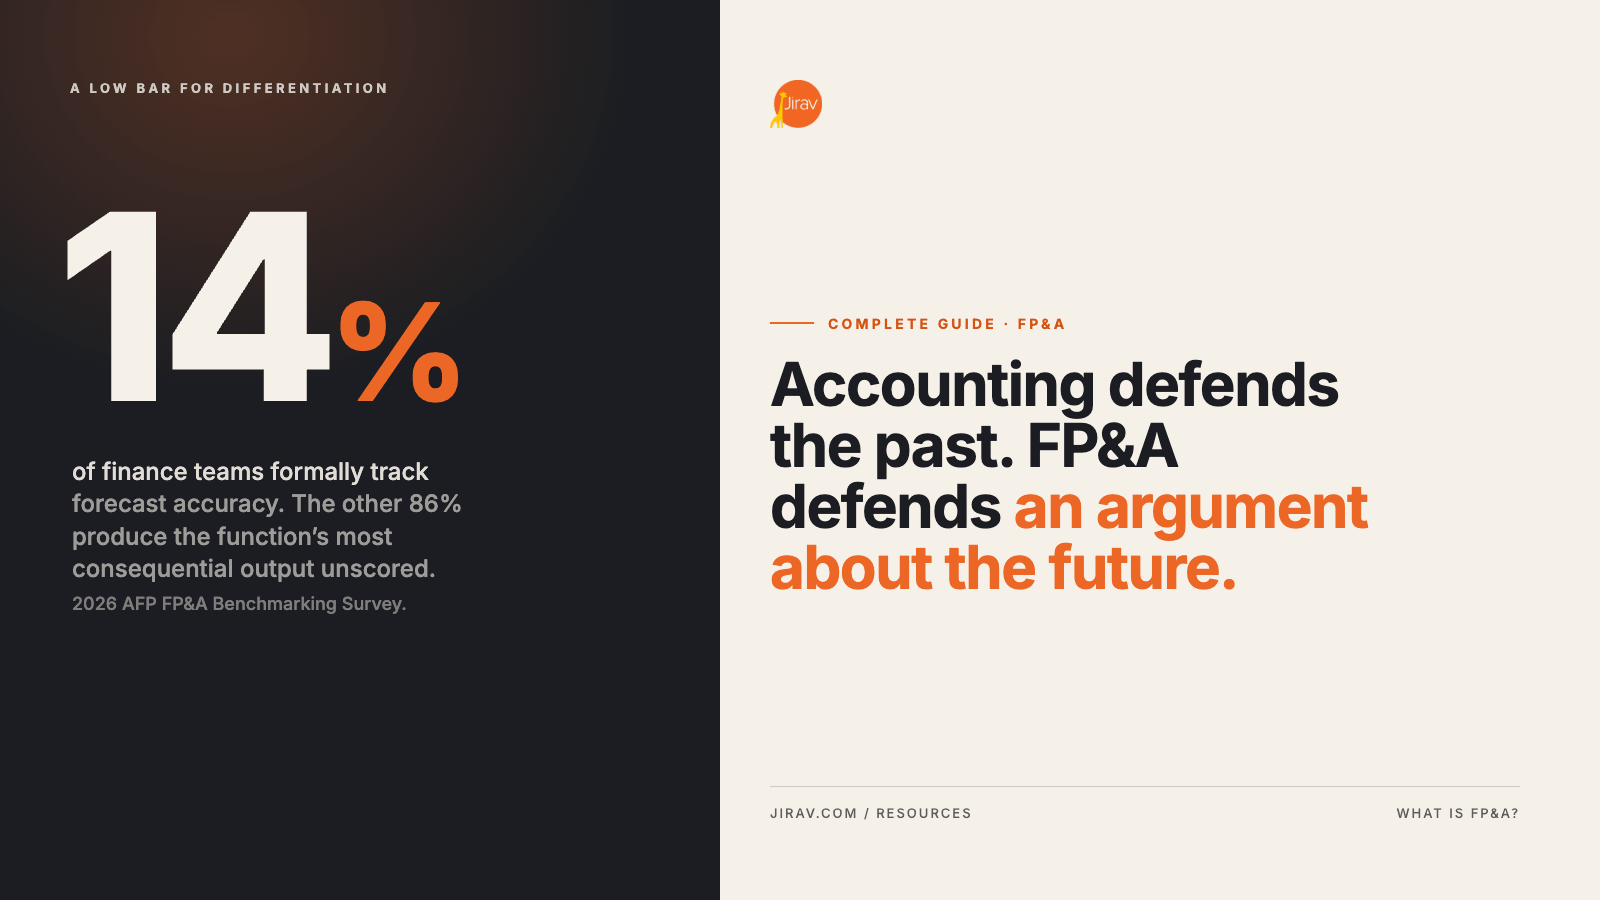
Financial planning and analysis (FP&A) is the finance function responsible for budgeting, forecasting, and analysis that supports business decisions. Where accounting records and reports what already happened, FP&A builds a forward view of what is likely to happen and what would change under different decisions. Its core outputs are the annual budget, an ongoing forecast, scenario analysis, and variance reporting that explains the gap between plan and actual.
That is the definition. The harder question, and the one that determines whether an FP&A function is worth what it costs, is how the work is actually organized. This guide covers the operating cycle, the distinction from accounting, what the benchmark data says about performance, and how the function is delivered in-house versus through an advisory firm.
How is FP&A different from accounting?
The two functions share a data source and almost nothing else. Accounting produces a defensible record of the past under a set of rules. FP&A produces a defensible argument about the future under a set of assumptions. Confusing them is the most common structural failure in a finance function, and it usually shows up as a team that produces excellent monthly reporting packages nobody uses to make a decision.
|
Accounting |
FP&A |
|
|---|---|---|
|
Orientation |
Backward: what happened |
Forward: what will happen and what would change it |
|
Governed by |
GAAP, tax code, audit standards |
Business judgment and management need |
|
Core output |
Financial statements, close, compliance filings |
Budget, forecast, scenarios, variance explanation |
|
Standard of quality |
Accuracy and defensibility |
Decision usefulness and driver traceability |
|
Failure mode |
Errors and restatements |
Precise numbers nobody acts on |
The practical consequence: the tooling requirements diverge. A reporting tool can be excellent at consolidating actuals and formatting them, and still be unable to answer the question FP&A exists to answer, which is what happens to cash if we make this hire. That requires a model with drivers behind it, not a report with filters on it.
What are the four core activities of FP&A?
Planning
Translating strategy into a financial structure. Planning sets the shape of the model: which drivers matter, how revenue is built, what the departmental structure is, and what the business is committing to over a multi-year horizon. This is the least frequent and highest-leverage activity, and the one most often skipped in favor of jumping straight to a budget.
Budgeting
Setting the resource commitment for a fixed period, usually a fiscal year, with named owners for each line. A budget is a decision about allocation, and it is fixed on purpose. Its value comes from being a stable benchmark against which performance can be measured.
Forecasting
Maintaining the current best estimate of where the business will land, updated as actuals arrive. Unlike the budget, the forecast is expected to change. The two coexist: the budget is the commitment, the forecast is the expectation, and the distance between them is management information.
Analysis
Explaining variance in terms of drivers rather than amounts, and answering forward-looking questions through scenario work. A variance report that says marketing spend was 12 percent over plan is reporting. A variance report that says marketing spend was over because the agency retainer started two months earlier than budgeted, and that the timing shift pulls 40,000 dollars of the annual budget into Q1 without changing the full-year total, is analysis.
What does the FP&A operating cycle look like?
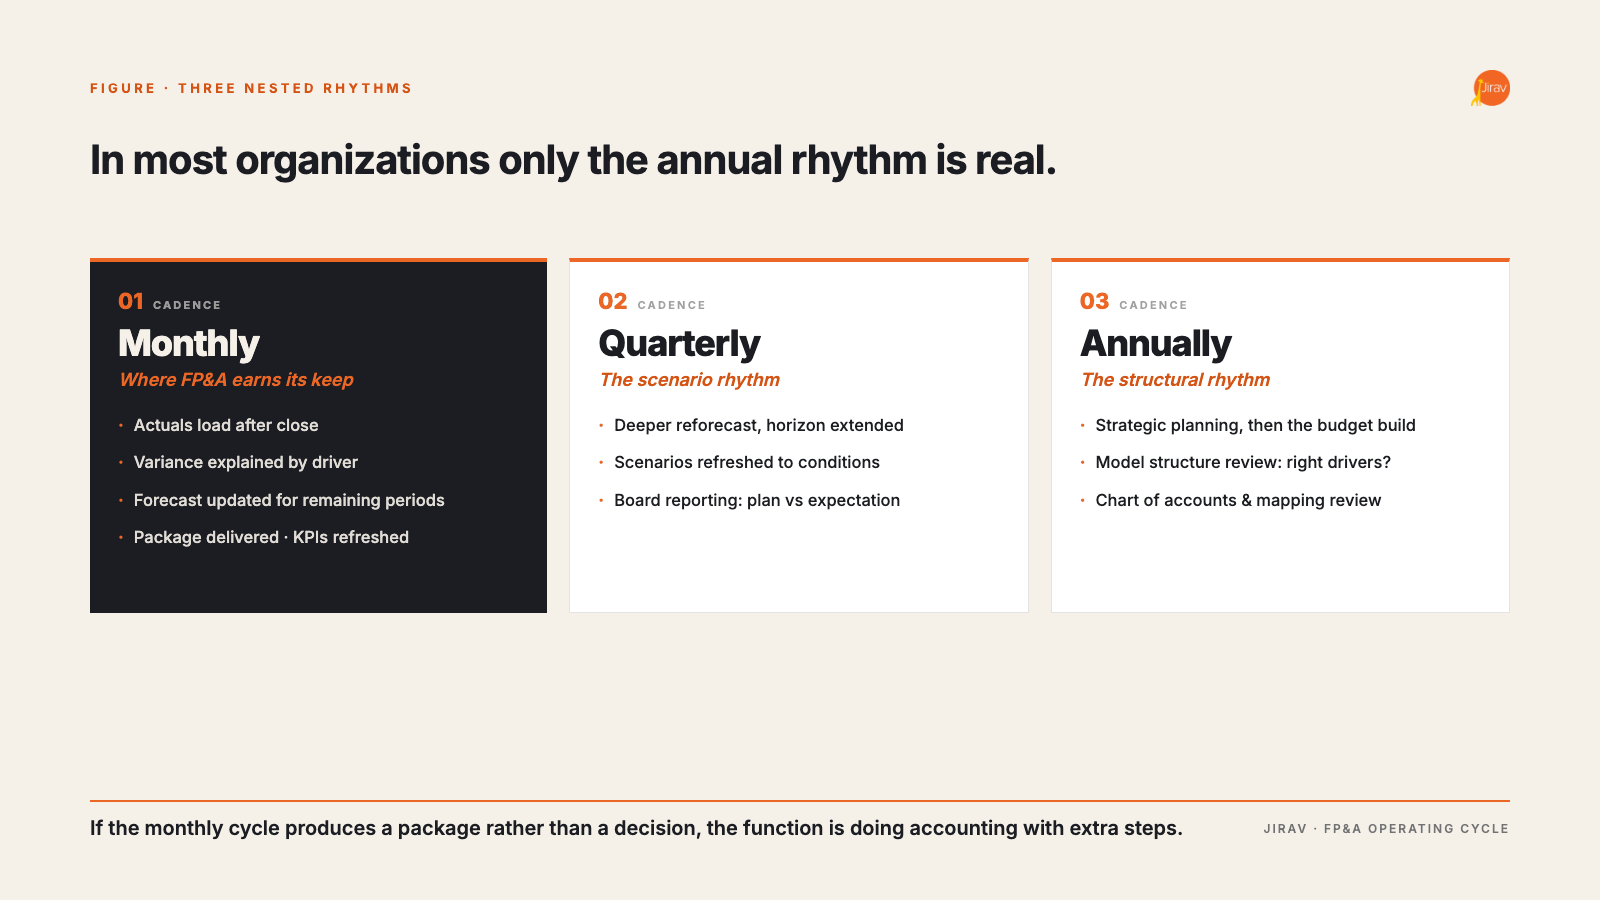
A functioning FP&A practice runs on three nested rhythms. The failure mode in most organizations is that only the annual rhythm is real and the other two are aspirational.
Monthly
- Close completes and actuals load into the model
- Variance analysis against budget, with driver-level explanation for material lines
- Forecast updated for the remaining periods, incorporating what the actuals revealed
- Reporting package delivered to leadership or, in an advisory context, to the client
- KPI and dashboard refresh, covered further in our guide to the KPIs every firm should track
Quarterly
- Deeper reforecast, often extending the horizon so the forward view never contracts
- Scenario refresh against current conditions
- Board or investor reporting, with the plan-versus-expectation gap made explicit
Annually
- Strategic planning, then the budget build from the resulting structure
- Model structure review: are the drivers still the right drivers?
- Chart of accounts and mapping review, so year-over-year comparability holds
The monthly rhythm is where FP&A either earns its keep or becomes overhead. If the monthly cycle produces a package rather than a decision, the function is doing accounting with extra steps.
What does good FP&A performance look like?
The benchmark data is unflattering, which is useful, because it sets a low bar for differentiation.
Start with measurement. The 2026 AFP FP&A Benchmarking Survey, which covers 332 finance professionals across 54 countries, found that only 14 percent of finance teams formally track forecast accuracy. The other 86 percent have no structured measure of whether their forward view is any good. Earlier joint research from AFP and APQC found a related pattern: nearly a third of participants do not measure FP&A effectiveness at all, and among those who do, forecast accuracy and budget accuracy are the two most common measures, cited by 68 and 59 percent respectively.
Then cycle time. APQC benchmarking puts top performers at the 25th percentile completing the annual budget in 28 days or less, close to twice as fast as organizations at the 75th percentile. APQC’s recommendation is counterintuitive and worth passing along to clients: starting the budget process later, closer to year end, tends to shorten it, because more of the current year is actual rather than forecast and there is less to negotiate.
Three things separate a strong FP&A function from a busy one:
- The forecast has a score. Accuracy is tracked against actuals so the team knows which assumptions are systematically wrong and can correct for them
- Variance is explained by driver. Every material variance resolves to a cause a business owner recognizes, not to a number
- Scenarios are same-day. A leadership question about a hiring change or a pricing move gets an answer in the meeting, which is only possible when scenarios are built into the model rather than duplicated from it
Who performs FP&A?
Two delivery models, with the split driven mostly by company size and finance maturity.
In-house FP&A appears once a company can justify dedicated headcount, typically somewhere past 50 employees or a scale where board reporting becomes formalized. The advantage is proximity to the business. The constraint is that a one or two person team spends most of its capacity on the monthly cycle and has little left for the analysis that justifies the role.
Outsourced or fractional FP&A, delivered by a CFO advisory firm, is now the more common path below that threshold. The firm brings a standardized model structure, a defined monthly cadence, and pattern recognition across a client base that an internal team of one cannot match. The constraint is context: the advisor is not in the hallway conversations, which makes the monthly touchpoint structurally more important than it is in-house.
For advisory firms, FP&A is also the service line that changes the economics of the practice. Compliance work is priced against a commodity market. Forward-looking advisory work is priced against the decision it improves. The gap between those two pricing logics is why the shift is worth the operational effort, and why the delivery model has to be standardized to be profitable. Our solution overview for accounting and CFO advisory firms covers how firms structure this.
What does an FP&A team actually need to run on?
The stack has three layers, and most dysfunction comes from asking one layer to do another layer’s job.
The source layer is the general ledger plus payroll, CRM, billing, and whatever operational systems carry the drivers. The model layer is where drivers connect to three-statement output. The presentation layer is dashboards and reporting packages.
Spreadsheets can serve as the model layer, and for a single company with a stable structure they often do. They break predictably under three conditions: multiple entities or clients, a workforce plan detailed enough to matter, and any requirement to produce scenarios on demand. At that point the spreadsheet is not a model, it is a set of interlocking assumptions with no audit trail and one person who understands it.
Jirav is built for the model layer specifically. It combines accounting, workforce, and operational data into a driver-based model that generates three-statement output, which means a change to a hiring assumption flows through the P&L, the balance sheet, and the cash flow statement without anyone maintaining the linkage. Workforce planning is native rather than a bolted-on tab. Scenarios are a property of the model, so a downside case can be built and shown live. And because it was designed for firms managing multiple clients, the same structure and templates are reusable across a book of business rather than rebuilt per engagement.
The point is not the feature list. It is that the model layer needs to be genuinely a model. If a tool can only refresh a report faster, it is improving the presentation layer and leaving the actual FP&A work in a spreadsheet. Our guide on what advisory firms should evaluate in forecasting software works through that distinction in detail.
What metrics does FP&A own?
There are two categories, and they get conflated constantly. The first is the business metrics FP&A reports on and forecasts. The second is the metrics that measure FP&A itself, which is the category most teams skip.
Business metrics vary by model. A recurring revenue business is forecasting net revenue retention, gross retention, acquisition cost payback, and the composition of growth between new, expansion, and churn. A professional services business is forecasting utilization, realization, effective billing rate, and backlog coverage. A product business is forecasting inventory turns, working capital cycle, and contribution margin by line. The forecast is only useful if it is built on the drivers that actually determine those metrics rather than on a growth percentage applied to a revenue line.
Function metrics measure whether FP&A is doing its job. Forecast accuracy against actuals, measured consistently over time and broken out by line so the team learns which assumptions are biased. Cycle time for the monthly reforecast, because a forecast that lands three weeks after close is describing history. Budget cycle time, benchmarked against the APQC figures above. And a softer but telling one: the share of leadership questions answered in the meeting rather than taken as follow-ups.
Advisory firms have a third category, which is practice metrics: revenue per client, realization on advisory engagements, and hours to onboard a new client onto the standard model. The last one is the leading indicator for whether the practice will scale. If client seven costs as much to onboard as client one, the model structure is not actually standardized.
How does an FP&A function mature?
Maturity progresses in a fairly predictable order, and skipping a stage tends to produce an expensive tool implementation that does not stick.
Stage one is reliable actuals. The close completes on a predictable schedule, the chart of accounts is clean enough to support departmental reporting, and the numbers reconcile. No forward-looking work is trustworthy until this holds, and a surprising number of FP&A initiatives fail here rather than at the modeling stage.
Stage two is a real budget. An annual plan with departmental structure and named owners, built from drivers rather than from last year plus a percentage. This is where the negotiation happens and where most of the political work of finance lives.
Stage three is a maintained forecast. The budget stays fixed while a separate forward view updates monthly. This is the step that most often gets skipped, usually by editing the budget in place, which quietly eliminates the ability to measure performance against a commitment.
Stage four is scenario capability. Alternative futures can be produced on demand because the model is driver-based rather than hard-coded. At this stage FP&A moves from reporting on decisions to participating in them.
Stage five is integrated planning, where the financial plan, the workforce plan, and the operating plan are one connected structure rather than three documents that get reconciled quarterly. This is the level the AFP benchmarking work identifies as the differentiator for high-performing teams, and it is where the gap between intent and execution is widest.
Where FP&A functions most commonly fail
- The budget becomes the forecast. The annual plan gets edited in place as actuals arrive, which destroys the benchmark and makes variance analysis meaningless. The rolling forecast exists precisely to avoid this
- Analysis stops at the variance amount. Reporting what moved without explaining why produces packages that get filed rather than used
- The forward window shrinks. A forecast that ends at fiscal year end offers three months of visibility by October, which is when visibility matters most
- Scenarios are promised rather than produced. If every what-if question becomes a follow-up item, leadership stops asking, and FP&A loses its seat in the decision
- Nobody owns the numbers. A departmental budget without a named owner who agreed to it is a forecast wearing a budget’s clothes
For the scenario problem specifically, our practical guide to scenario planning covers how to structure a default scenario set so the answer already exists when the question is asked.
The short version
FP&A is the function that turns financial data into forward-looking decisions. It runs on a monthly cycle of actuals, variance, and reforecast, sitting inside a quarterly scenario rhythm and an annual planning rhythm. It is distinguished from accounting by orientation: accounting defends a record of the past, FP&A defends an argument about the future. And it requires a genuine model underneath it, because the question it exists to answer, what happens if we change this, cannot be answered by a report. If the underlying structure is not solid, start with three-statement financial models and build from there.
|
See what an FP&A model layer looks like in practice Driver-based three-statement modeling, native workforce planning, and scenarios built into the model rather than duplicated from it. Purpose-built for accounting and CFO advisory firms. |