

Search "financial forecasting software" and the results blur together. Budgeting apps, reporting dashboards, business-intelligence connectors, and a handful of genuine modeling engines all share the same category page. For a fractional CFO or FP&A advisory firm, that blur is the whole problem. The tools look interchangeable right up until you try to rebuild a client's three-way forecast live in a meeting and discover the platform can only visualize numbers something else already calculated.
You already know the difference between a model and a report. The harder question is which software preserves that difference at the firm level, across a book of clients, without collapsing back into a folder of fragile spreadsheets. This is a buyer's guide written for that decision, not an introduction to forecasting.
Reporting tools and modeling tools are not the same category
The fastest way to evaluate forecasting software is to ask what the tool does with a driver. A reporting tool ingests actuals, maps them to a chart of accounts, and renders them attractively. Change an assumption and nothing downstream moves, because the assumptions live somewhere else (usually a spreadsheet). A modeling tool treats drivers as first-class inputs: change headcount, pricing, or collection timing, and the income statement, balance sheet, and cash flow statement all recalculate together.
For an advisory engagement, that distinction is the value proposition. Clients do not pay a premium for a prettier version of last month's actuals. They pay for the answer to "what happens if we do this," and that answer only exists if the software can model, not merely report.
The spreadsheet baseline you are migrating from
Most firms arrive at this decision from Excel, and Excel sets a low bar for reliability. A 2024 peer-reviewed literature review in Frontiers of Computer Science found that roughly 94% of real-world business spreadsheets contain errors. At the scale of one analyst's working file, that is a manageable risk. Across a client book, where models are cloned, emailed, and rolled forward by different staff every month, it becomes a structural liability. Every broken link is a client conversation built on a number nobody can fully trust.
The point is not that spreadsheets are useless. It is that a spreadsheet is a workspace, not a system of record for the forward-looking models you intend to defend in front of a client.
The deeper issue is ownership. A spreadsheet model lives in one person's head and one person's file. When that person is on vacation, or leaves, the logic leaves with them. Software that holds the model centrally turns a personal artifact into a firm asset, which is the precondition for any of the standardization that follows.
What forecasting software has to do for a firm
Strip away the marketing and the requirements for an advisory practice come down to five capabilities. Use them as a demo checklist, not a feature wish list.
- Three-way integration. The forecast should tie the income statement, balance sheet, and cash flow together so a change in one flows to the others. A revenue model that cannot show the cash impact is half a model.
- Driver-based logic. Assumptions should be explicit, editable inputs, not values buried inside formulas. This is what lets you answer a scenario question during the meeting rather than after it.
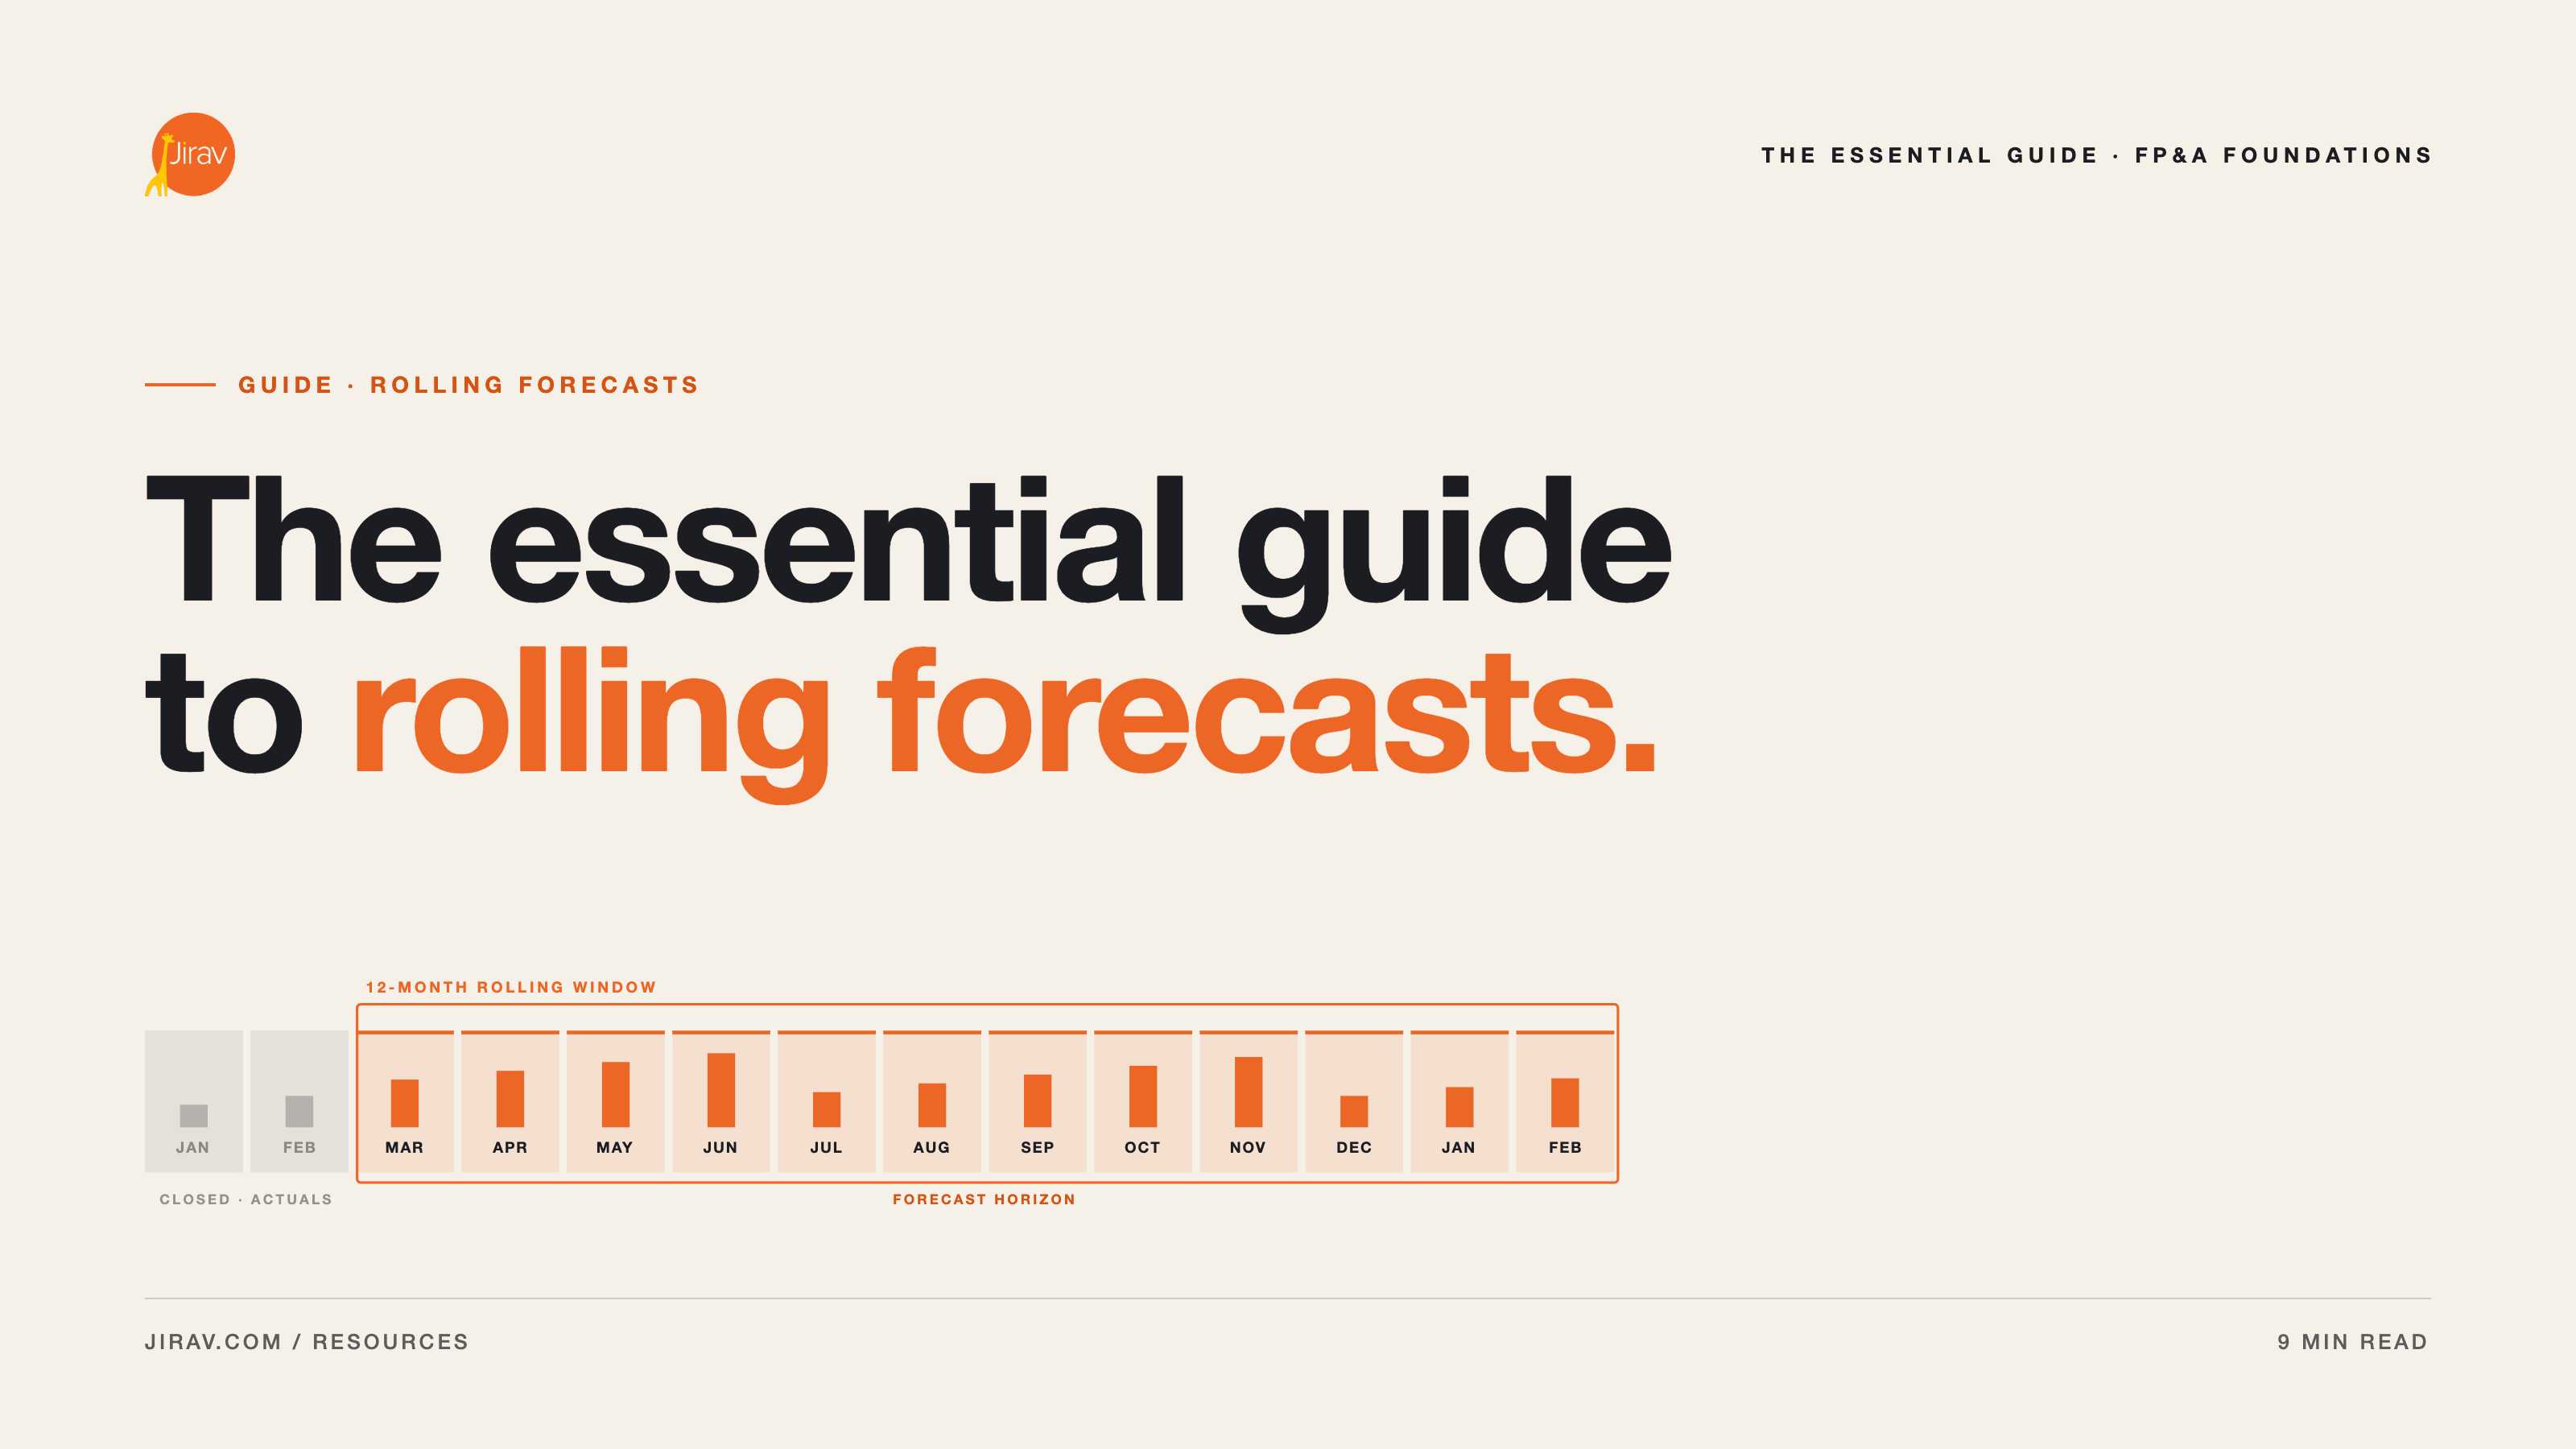
- Rolling forecasts. Actuals should import and roll forward on a cadence without a manual rebuild, because the monthly touchpoint is the product in an advisory relationship.
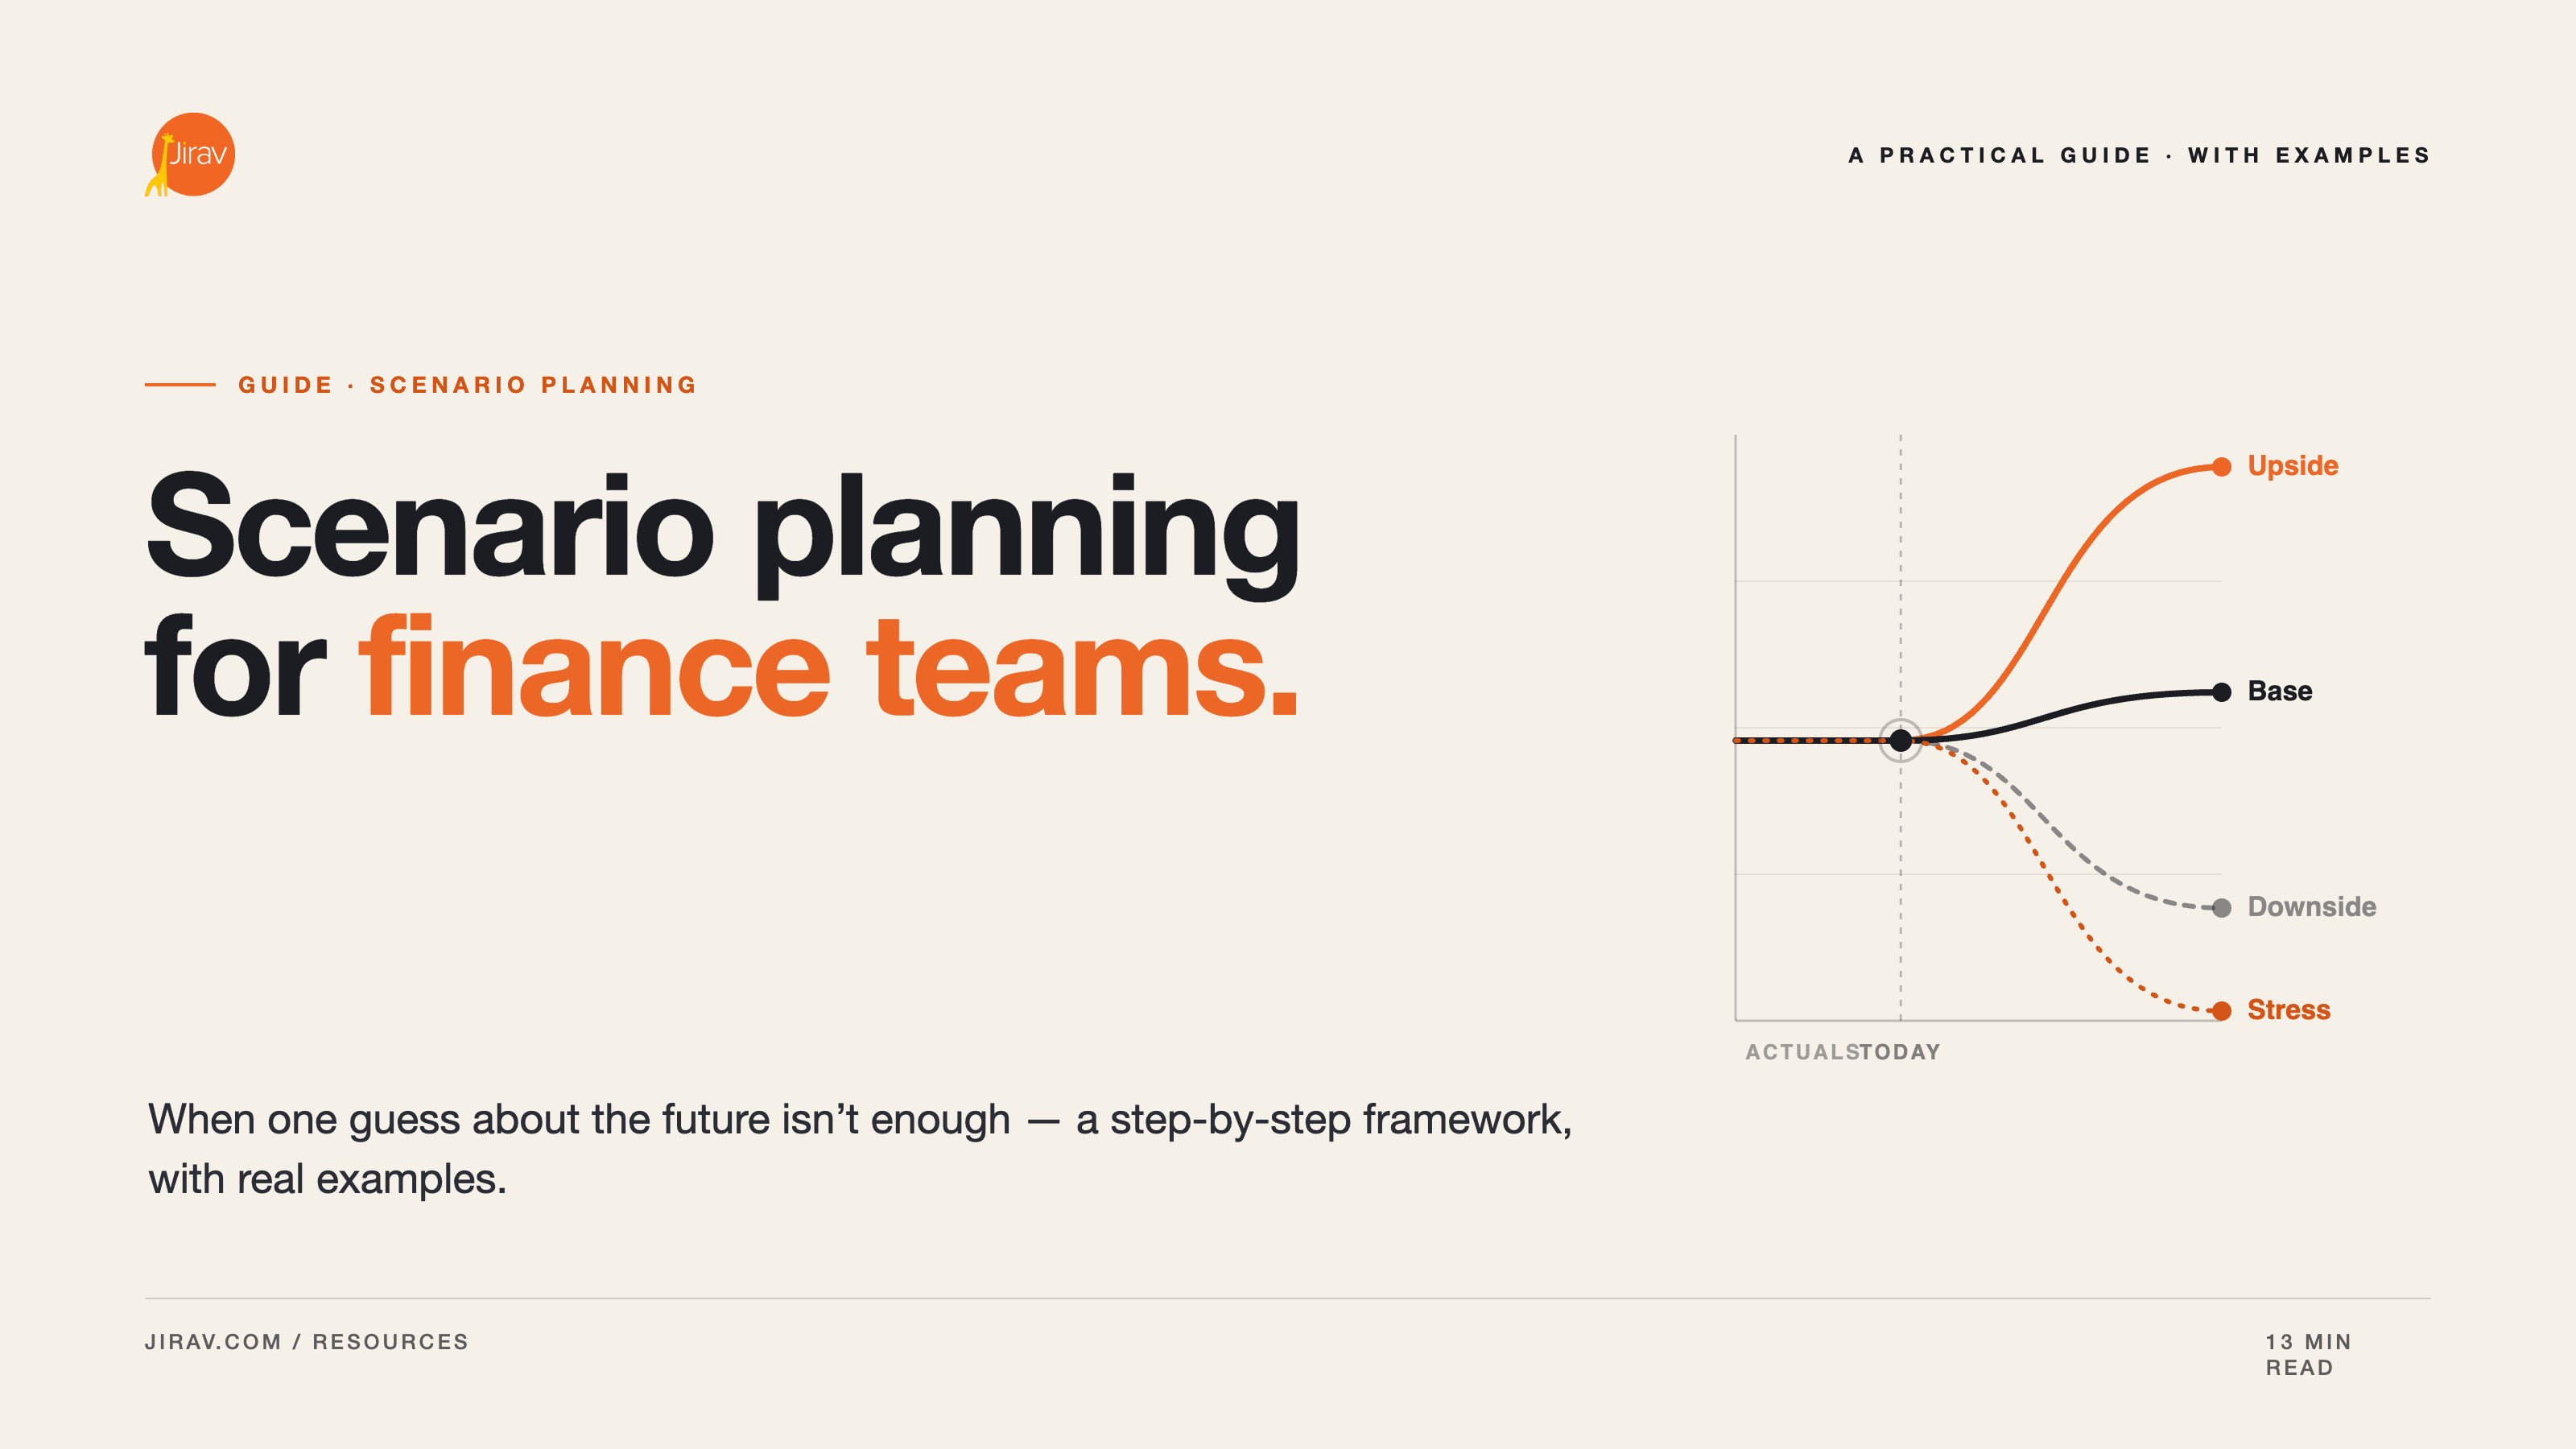
- Scenario comparison. Base, best, and worst case should sit side by side with variance visible, so you can guide a decision instead of describing a single future.
- Standardization across clients. Templates, cloning, and consistent chart-of-accounts mapping matter more at the firm level than any single feature, because they are what let you add clients without adding proportional staff.
Standardization is the feature that scales a practice
Notice that four of those five criteria describe a single model, and only the last describes the firm. The last one is the one that actually sets your economics. A brilliant model you rebuild by hand for every client caps your practice at the number of clients your team can manually maintain. A standardized template you clone, map once, and roll forward is what lets headcount and client count grow on different curves.
This is the test most reporting tools quietly fail. They can produce a polished output for one entity, but they assume someone else owns the model logic, so there is nothing to standardize except formatting. A modeling platform built for firms treats the template as the asset: the chart-of-accounts mapping, the driver structure, and the report package travel from one client to the next, and a new engagement starts from a known-good baseline instead of a blank workbook.
Where Jirav fits
This is the gap Jirav was built to close for accounting and advisory firms. It is a driver-based financial modeling platform rather than a reporting layer, which means the three-way statements recalculate from the assumptions you control. You connect a client's accounting, workforce, and operational data through integrations, build the model once, and roll it forward as actuals arrive.
Two capabilities tend to matter most in practice. The first is rolling forecasts that update from the latest actuals without a manual rebuild, which protects the monthly client cadence. The second is Auto Forecast, which generates a starting forecast from historical trends and seasonality so you are refining a baseline rather than building from a blank sheet. Neither replaces your judgment. Both remove the mechanical work that keeps firms from scaling.
Forecasts also get more accurate when they are built bottom-up from real activity rather than top-down from a single growth percentage. Driving revenue and expense lines from the operational data that produces them (units, headcount, pipeline, usage) is the difference between a forecast a client believes and a number you simply assert. It also gives you something concrete to adjust when a client asks what a decision would do.
Questions that separate the categories in a demo
When you sit through a shortlist of demos, a few concrete questions expose the modeling-versus-reporting divide faster than any feature matrix. Can I change a single assumption and watch all three statements move? Can I clone this client's model as a template for the next one? Can I roll the forecast forward without rebuilding it? Can I compare two scenarios with variance in the same view?
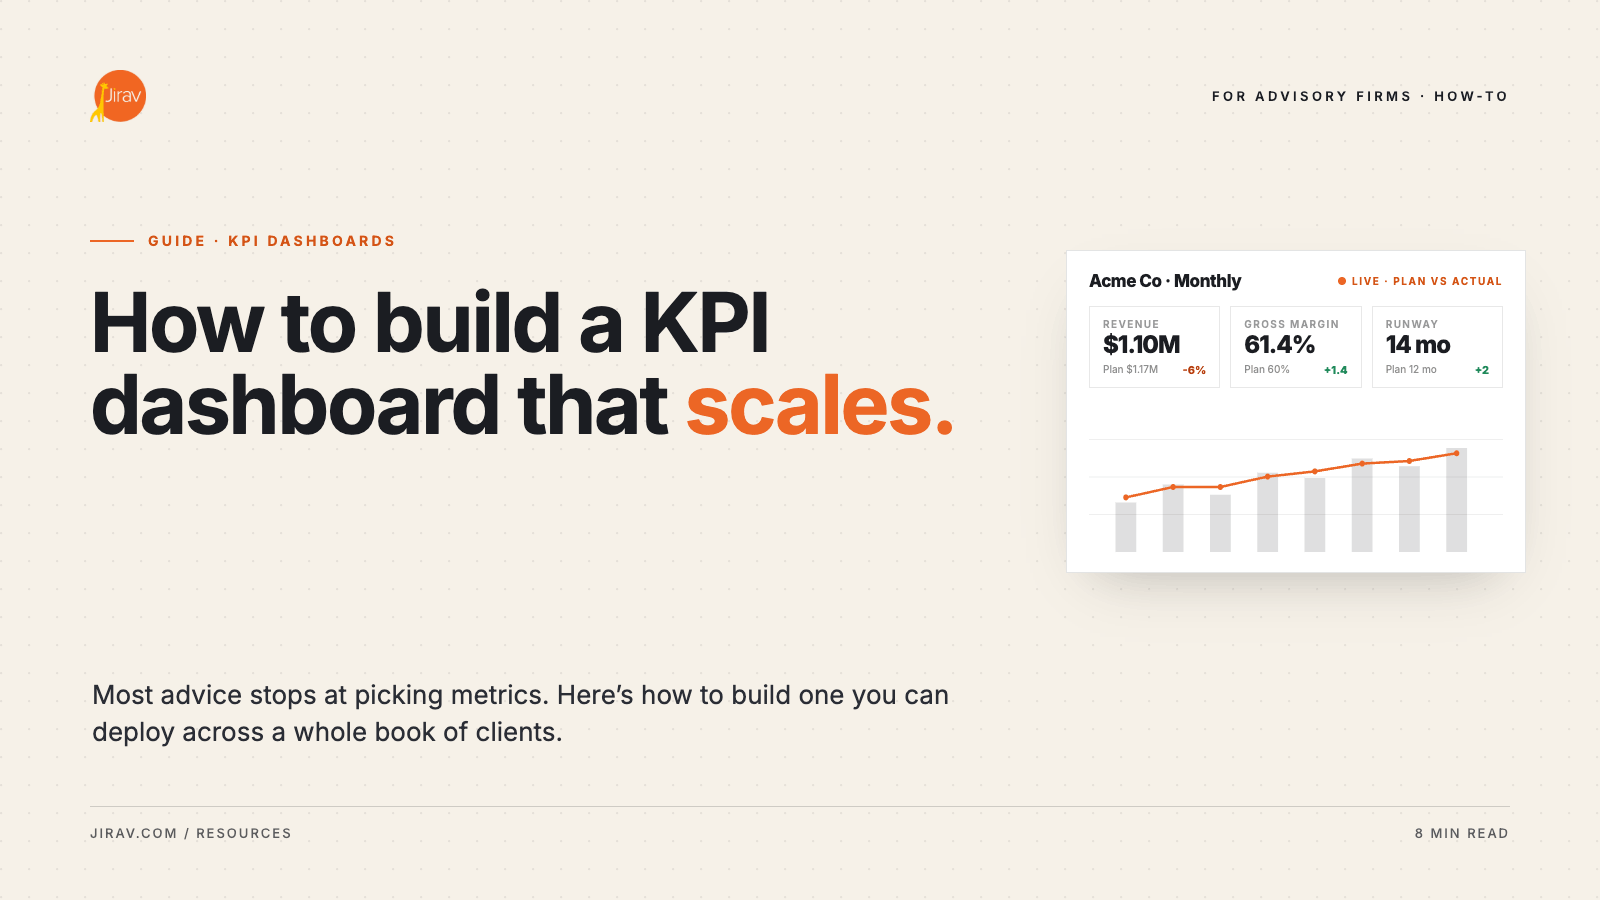
A reporting tool will struggle with at least one of these. A modeling platform built for firms will not. Pricing and integrations matter too, but they are secondary to this core test. A cheaper tool that only reports is not actually cheaper once you account for the spreadsheet work it pushes back onto your team. If you want to see how a reporting and dashboard layer should sit on top of a live model rather than beside it, that is the same test from the other direction.
The cost of choosing a reporting tool by mistake
The expensive mistake is rarely overpaying for software. It is buying a reporting tool, discovering it cannot model, and quietly rebuilding the modeling work in spreadsheets anyway. Now you are paying for the platform and absorbing the spreadsheet risk, with staff time split across two systems that do not reconcile. The sticker price of a pure reporting tool is real, but the rework it forces back onto your team is the number that actually shows up in your margins. Evaluate against the modeling test first, then compare price.
The firm-level payoff
This distinction earns its attention because it decides whether your advisory practice can scale. Firms that standardize forecasting on a modeling platform serve more clients per professional and move up the value chain from reporting history to advising on the future. The market is rewarding exactly that shift: the 2024 CPA.com and AICPA PCPS CAS Benchmark Survey found client advisory services growing at a median rate of 17%, the fastest-growing service area in public accounting. Software that models instead of merely displaying is the technical foundation under that growth.
There is a sequencing point worth making explicit. You do not need every client on the platform on day one. The firms that migrate well usually start with the handful of clients who already buy advisory work, prove the template and the cadence there, and then roll the standardized model out to the rest of the book. The software decision is what makes that rollout repeatable instead of a series of one-off rebuilds.
If you are weighing a move off spreadsheets, the most useful next step is to watch a three-way model rebuilt live rather than read another comparison chart. You can request a walkthrough built for advisory firms.