

What a financial forecast actually is
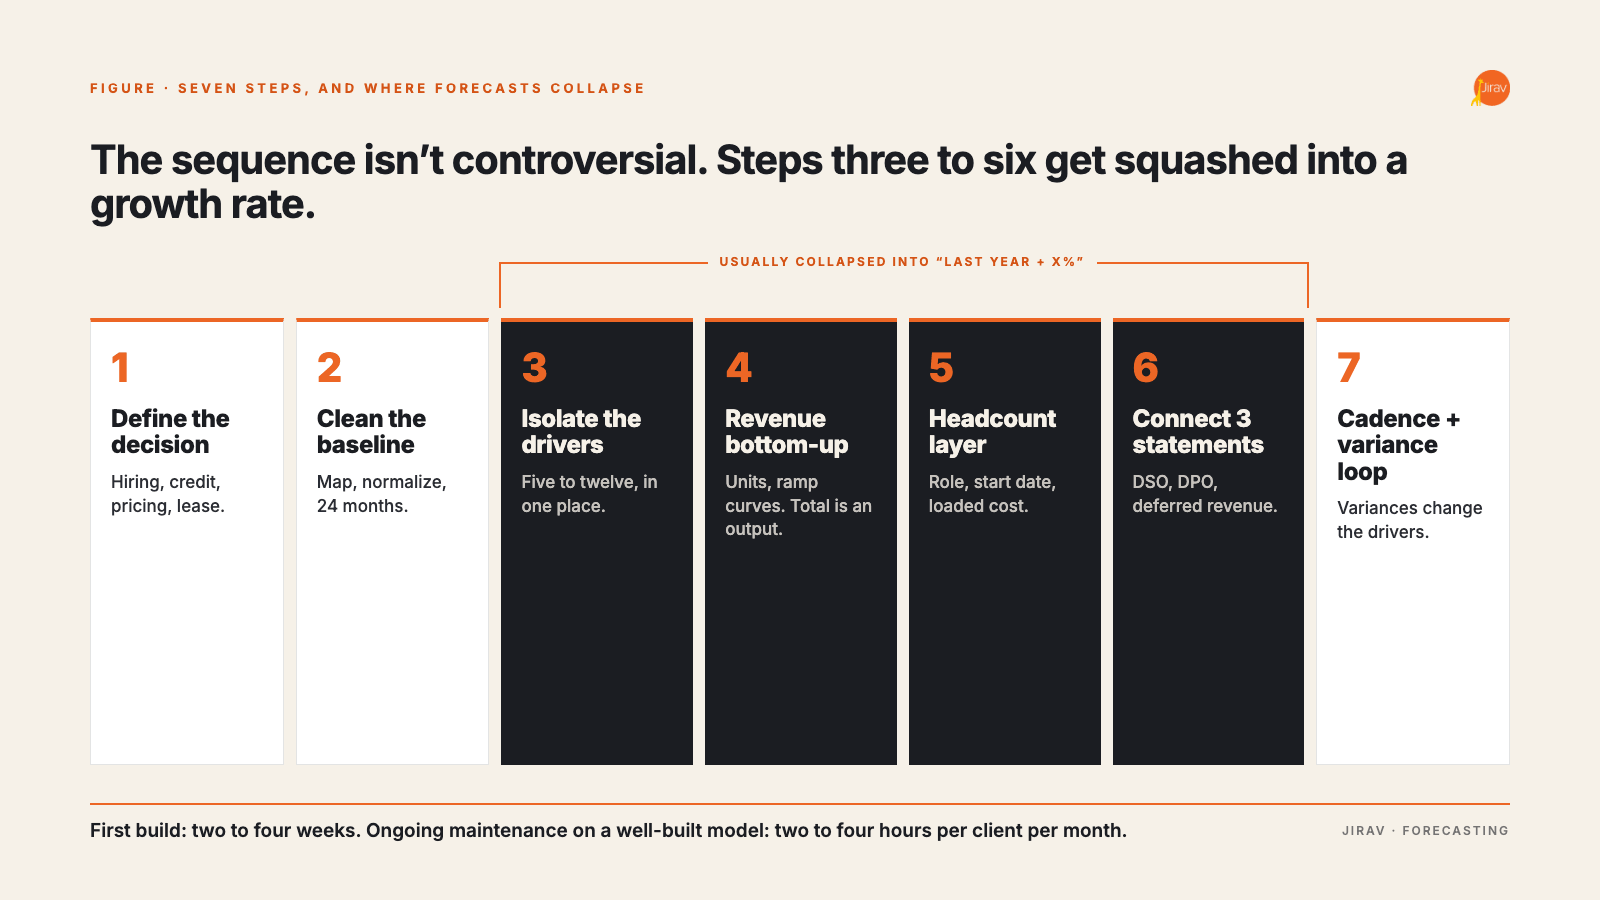
A financial forecast is a forward-looking model of a company’s revenue, expenses, headcount, cash position, and balance sheet, built from the operational drivers that produce those numbers rather than extrapolated from historical totals. Creating one is a seven-step process: define the decision the forecast has to support, establish a clean actuals baseline, isolate the drivers, model revenue bottom-up, model headcount as its own layer, connect all three statements, and set a re-forecast cadence with a variance loop back into the model.
That sequence is not controversial. The reason forecasts still fail is almost never the sequence. It is that steps three through six get collapsed into a growth percentage applied to last year, and the result is a projection that cannot answer a follow-up question. When a client asks what happens if the second sales hire slips a quarter, a percentage-based forecast has nothing to say. A driver-based model recalculates.
That distinction, between reporting the future and modeling it, is the one that determines whether a forecast becomes a recurring advisory deliverable or a one-time deck. Forecasting is one component of the broader FP&A function, and the steps below assume the reporting and close disciplines around it are already in place.
Step 1: Define the decision the forecast has to support
Before any structure gets built, name the decisions the forecast will be used to make over the next four quarters. Hiring approvals, a line of credit renewal, a pricing change, a lease commitment, a raise. The decision set determines the granularity, the horizon, and the output format. Everything downstream is a consequence of it.
This is the step most often skipped, and skipping it produces a specific failure: a beautifully built model at the wrong grain. A forecast built to support monthly hiring decisions needs headcount modeled by role with start dates and fully loaded cost. A forecast built to support a debt covenant conversation needs a balance sheet and a rolling thirteen-week cash view. Those are different builds. Deciding which one you are doing takes fifteen minutes and saves a rebuild.
For advisory engagements, write the decision set down and confirm it with the client in the kickoff. It becomes the scope boundary later, when a client asks for a product-level P&L that the engagement was never priced to support.
Step 2: Establish a clean actuals baseline
A forecast is only as good as the actuals it sits on. The baseline step is not a data sync. It is a mapping exercise: deciding how the general ledger rolls into the model’s account structure, what gets consolidated, what gets excluded, and how many months of history the model needs.
Three things to resolve before modeling starts:
- Account mapping. Client charts of accounts are rarely forecast-ready. Departmental detail is often missing, and one-off accounts accumulate. Map the GL to a stable forecast structure once, then keep the mapping as the client’s chart drifts.
- Normalization. Identify and flag the non-recurring items sitting in history: PPP-era anomalies, owner distributions booked as expense, a settlement, a single outsized customer. Leaving them in the baseline poisons every driver you derive from it.
- History depth. Twenty-four months is the practical minimum for seasonality. Twelve months gives you a trend and no pattern. For a business under two years old, seasonality has to be assumed rather than derived, and that assumption should be explicit in the model.
The industry data here is blunt. In the 2025 AFP FP&A Benchmarking Survey Report on technology and data, finance professionals identified data problems, not skills and not tools, as the primary obstacle to technology success: 61% cited a lack of data reliability and 60% cited a lack of accessible data. The baseline step is where that gets fixed or inherited.
Step 3: Isolate the drivers that actually move the numbers
A driver is an operational quantity that, when it changes, changes a financial line. Units sold, billable hours, average contract value, headcount by role, close rate, churn, price per seat. The modeling work in step three is deciding which drivers are worth modeling and which are noise.
The practical test: a driver earns a place in the model if the client can influence it, measure it, and would change a decision based on it. That usually leaves five to twelve drivers for a company under $50 million in revenue. Modeling thirty drivers produces a model nobody maintains.
Two structural choices matter here:
- Where the driver sits. Drivers belong in one place, referenced everywhere, not hard-coded into individual line items. This is what makes scenario work possible later. If changing the close rate requires editing eleven cells, the model is not driver-based, it is decorated.
- How the driver connects. Write the relationship explicitly. Revenue equals leads times close rate times average contract value. Support cost equals customer count divided by accounts per rep times fully loaded rep cost. Relationships that live in someone’s head do not survive staff turnover.
Worth separating: A budget and a forecast use the same drivers but answer different questions. The budget is the commitment; the forecast is the current expectation. If you are treating them as one artifact, the distinction is worth reading through before you build.
Step 4: Model revenue bottom-up
Revenue is where forecasts earn or lose credibility, and it is the line most often built top-down because top-down is fast. Bottom-up means building revenue from the units that generate it and letting the total be an output rather than an input.
What bottom-up looks like by model type:
|
Business model |
Build revenue from |
Watch for |
|---|---|---|
|
Subscription |
Opening ARR, new bookings by segment, expansion, contraction, churn, then convert to recognized revenue |
Modeling net ARR growth as one number instead of four separate movements |
|
Professional services |
Billable headcount, utilization target, realization rate, bill rate by level |
Assuming full utilization on new hires from month one |
|
Product or distribution |
Units by channel, price per unit, returns and discount rate |
Blended pricing that hides a shifting channel mix |
|
Usage-based |
Active accounts, usage per account, price per unit, overage behavior |
Straight-lining usage when it is genuinely seasonal |
The ramp assumption deserves specific attention. New sales hires, new locations, and new products almost never produce at steady-state rates immediately, and forecasts that assume they do fail within two quarters. Build the ramp curve explicitly: month one at some fraction of quota, reaching full productivity at a stated month. Then the ramp itself becomes something you can test against actuals.
Step 5: Model headcount as its own layer
People cost is the largest expense line in most advisory-client businesses and the one most sensitive to timing. It should not live inside a general operating expense schedule as a percentage of revenue.
A headcount layer models each role or role group with a start date, a base compensation figure, a loading factor for taxes and benefits, and a department assignment that routes the cost to the right line. Done properly, it produces three things a percentage-based approach cannot:
- Accurate expense timing. A hire starting in month seven costs six months of salary in the year, not twelve, and not an annualized average.
- A usable hiring plan. The client sees the roles, the dates, and the cumulative burn implication as one view.
- Real scenario capability. Delaying two hires by a quarter is one date change, and the cash impact flows through immediately.
For firms serving multiple clients, this is also where templating pays. The headcount structure is largely identical across a client book. The role names change; the mechanics do not.
Step 6: Connect all three statements
A forecast that produces only a projected income statement is a partial answer. Profit is not cash, and the questions clients actually escalate are cash questions: whether payroll clears, whether the covenant holds, whether the receivable cycle can absorb a growth push.
Connecting the statements means the P&L feeds the balance sheet and the balance sheet drives the cash flow statement, with the working capital assumptions stated rather than plugged. The ones that matter most:
- Days sales outstanding. Derived from actual collection history, not the stated payment terms. The gap between the two is often the entire cash story.
- Days payable outstanding and any deliberate stretching the client is doing.
- Inventory turns where relevant, including any planned build ahead of a season.
- Deferred revenue movement for subscription and retainer models, which is where the profit-to-cash divergence usually hides.
- Debt schedules with actual amortization, not straight-line approximations.
The test of a connected model is simple: change one revenue driver and watch whether the ending cash balance moves for the right reasons and by a defensible amount. If cash does not move, the statements are sitting next to each other rather than linked. Cash flow forecasting is the downstream discipline this step makes possible.
Step 7: Set the re-forecast cadence and close the variance loop
A forecast built once and revisited annually is a budget with better formatting. The value compounds when the model is re-forecast on a fixed cadence and the variances feed back into the drivers.
A workable cadence for most advisory engagements:
|
Cadence |
What happens |
Who sees it |
|---|---|---|
|
Monthly |
Actuals load, variance review against plan, driver assumptions adjusted where the miss is structural rather than timing |
Finance team and owner |
|
Quarterly |
Full re-forecast of remaining periods, scenario refresh, hiring plan re-confirmed |
Owner, leadership, lender or board |
|
Annually |
New budget build using the current model as the starting structure |
All stakeholders |
The loop only closes if variances change the model. A variance review that documents the gap and leaves the drivers untouched produces the same miss again next month. If the close rate has run at 18% for four consecutive months against a 25% assumption, the assumption is wrong, and updating it is the work.
Where the build usually breaks
Everything above is achievable in a spreadsheet. Plenty of excellent models live in Excel and Google Sheets, and 96% of FP&A professionals still use spreadsheets for planning according to AFP’s benchmarking work. The constraint is not capability. It is repetition.
A single spreadsheet model for a single company is manageable. The strain shows up at scale, in three specific places:
- Actuals refresh. Manually pulling and mapping trial balances every month across a client book consumes the hours that were supposed to fund the advisory margin.
- Scenario proliferation. Each scenario becomes a file copy. Within two quarters nobody is certain which version is current.
- Template drift. Fifteen client models that started identical diverge into fifteen different models, and a methodology improvement has to be applied fifteen times by hand.
This is where purpose-built FP&A tooling changes the economics rather than the method. Jirav was built for this specific pattern: connected actuals from the general ledger, payroll, and operational sources; driver-based planning and budgeting with headcount modeled as its own layer; three-statement output generated rather than assembled; and a partner console that lets a firm build a model once and deploy it across a client book. Auto Forecast handles the baseline projection from historical data, seasonality, and trend, which means the starting point is generated and the team’s time goes to the assumptions that require judgment.
If you are at the point of comparing options, what advisory firms should actually evaluate in forecasting software covers the criteria that only start to matter once you are running models across a book rather than a single company.
The seven steps do not change. What changes is how many clients one person can run them for.
How long should building a financial forecast take?
For a first full build on a new client with clean accounting, plan on two to four weeks of elapsed time: roughly a week on baseline and mapping, a week on the revenue and headcount build, and a week on the three-statement connection and review. Ongoing monthly maintenance on a well-built model should run two to four hours per client.
The annual budget cycle is a separate benchmark and a useful sanity check. APQC finds that top-performing organizations complete the annual budget in 28 days or less, roughly twice as fast as organizations at the 75th percentile. Cycles that stretch past eight weeks are usually a symptom of unclear targets or too many negotiation rounds, not of insufficient modeling detail.
Three failure modes worth designing against
False precision
A model with forty drivers and twelve decimal places is not more accurate than one with eight drivers. It is harder to maintain and harder to defend. Precision should match the quality of the underlying data and the materiality of the decision.
The single-scenario forecast
One forecast line implies a certainty nobody has. Base, upside, and downside cases make the range explicit and make the conversation about which levers matter. Scenario planning is most useful when the scenarios differ by driver assumption rather than by an applied haircut.
Modeling without a delivery format
A technically sound model that reaches the client as a spreadsheet tab gets ignored. Decide up front what the recurring output is: a monthly package, a dashboard, a board section. The model exists to feed that.
The short version
Define the decision. Clean the baseline. Isolate the drivers. Build revenue bottom-up and headcount separately. Connect the statements. Re-forecast on a cadence and let variances change the model. The steps are the same whether you are forecasting one company or forty. The difference at forty is whether your tooling was built for it.
|
Build forecasts your clients can actually act on Jirav gives advisory firms driver-based planning, connected actuals, three-statement output, and a partner console built for running models across an entire client book. |