

A professional services client is one of the few businesses where the largest expense line and the revenue engine are the same thing. Hire a consultant and you have added fully loaded cost on day one and capacity that may not bill for another six weeks. Lose one and revenue walks out with them. Push a start date by a quarter and the top line moves, not just the payroll line.
That single fact breaks most of the model templates an advisory practice carries around. A SaaS model starts with bookings and works down. A consumer goods model starts with units and price. A professional services model starts with people, and everything downstream is a consequence of how those people are deployed.
If your book includes agencies, consultancies, law firms, engineering shops, or IT services providers, the modeling job is specific enough to deserve its own approach. Here is what that approach looks like: the revenue engine, the KPI set, the scenarios worth pre-building, and the point at which the spreadsheet stops paying for itself.
The revenue engine is a headcount model
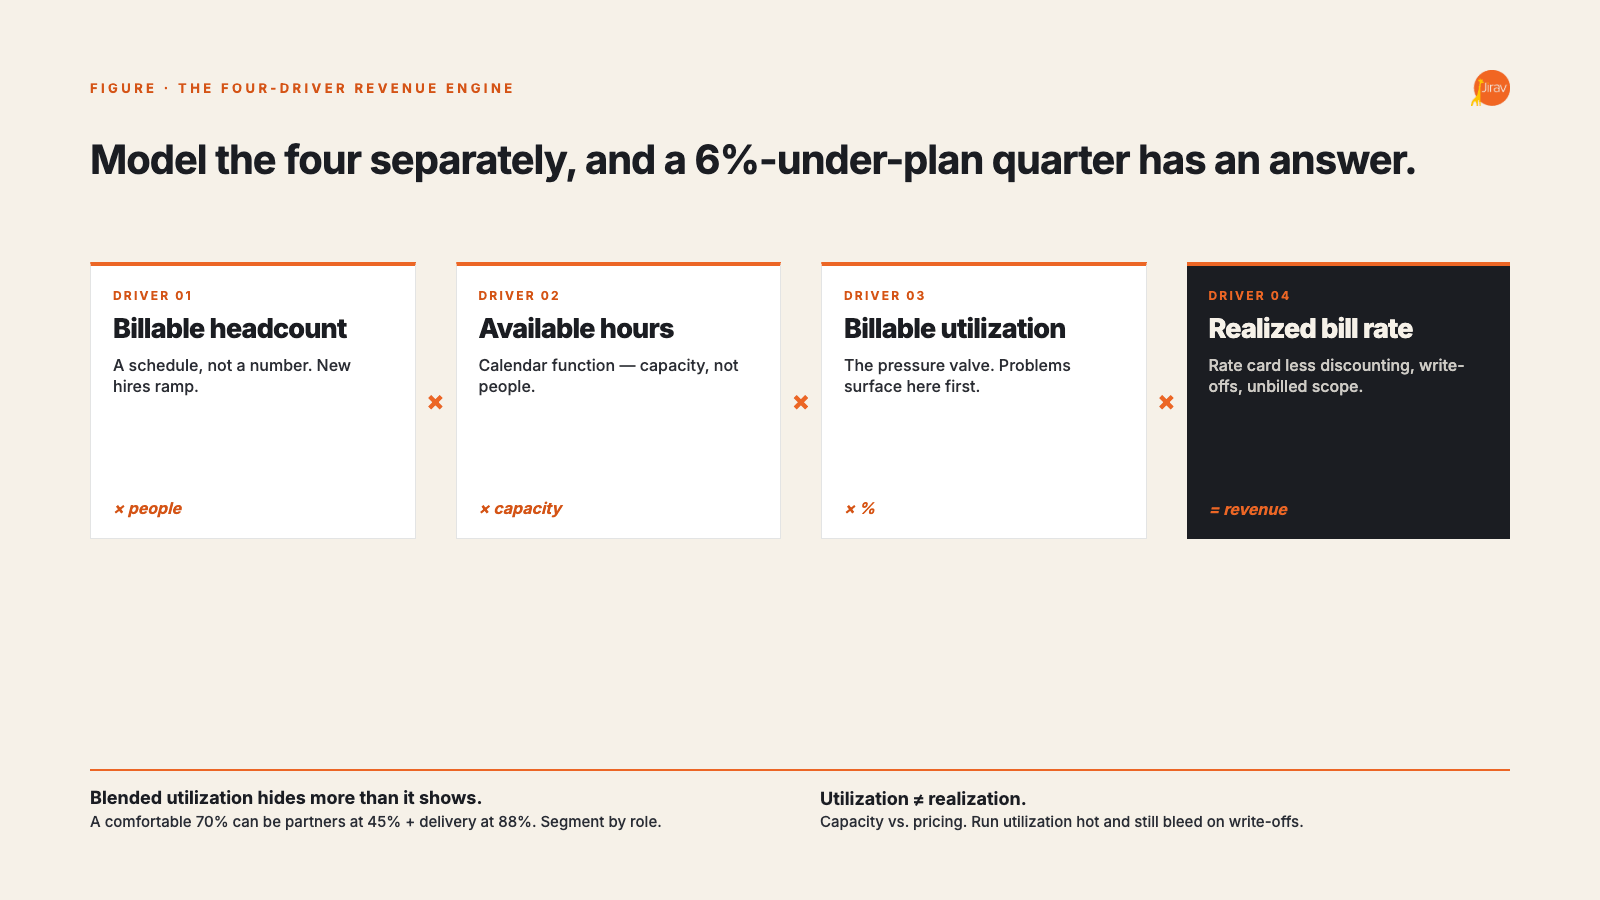
Revenue for a billable services business resolves to four drivers:
Billable headcount x available hours x billable utilization x realized bill rate
Each of the four behaves differently, and that is precisely why they have to be modeled separately.
- Billable headcount is a schedule, not a number. New hires ramp. A consultant who starts in March is not billing at target utilization in March, and a model that treats headcount as a monthly integer will overstate first-quarter revenue on every hire.
- Available hours are a calendar function. Standard working year, less holidays, PTO, training, and internal initiatives. The number that matters is capacity, not people.
- Billable utilization is the pressure valve. It absorbs everything the firm fails to sell and everything it fails to staff. When something goes wrong anywhere else in the business, utilization is where it surfaces first.
- Realized bill rate is not the rate card. It is the rate card less discounting, less write-offs, less scope delivered but never invoiced.
Collapse these into one blended revenue assumption and you get a forecast that cannot be interrogated. Suppose a client lands 6% under plan. Was it a hire that slipped, a ramp that took longer than assumed, three points of utilization erosion, or a discount conceded to win a competitive bid? A revenue-line forecast cannot answer that. A driver-based forecast can, and it can answer it in week three of the quarter rather than in the close.
This is also why, for a services client, the workforce plan is not a supporting schedule. It is the revenue plan. Any tool that treats headcount purely as an expense input is modeling the wrong business.
Fixed fee and time and materials are two different models
One structural distinction gets flattened constantly. Time and materials work converts hours directly into revenue, so utilization and realized rate carry the model. Fixed fee work severs that link: revenue is set at signature, and margin becomes a function of how many hours the delivery team actually consumes against the estimate. Overrun on a T&M project is a billing conversation. Overrun on a fixed fee project is margin, gone.
A model that forecasts blended project margin will therefore drift, because the two revenue types respond to different levers. Split them at the revenue layer, carry separate margin assumptions, and forecast overrun explicitly on the fixed fee book. Clients who have never seen that split done properly tend to discover that their most prestigious engagements are their least profitable.
What the benchmark data actually says
SPI Research's 2026 Professional Services Maturity Benchmark draws on 509 professional services organizations employing more than 245,000 consultants and generating close to $63 billion in services revenue. The interesting finding is not the industry average. It is the spread. Firms at the top of the maturity model outperform Level 2 peers by roughly 1,200% on revenue growth, 250% on project margin, and 42% on billable utilization.
Gaps that size are not explained by pricing power or market luck. They are operating discipline: forecast accuracy, resource visibility, and the ability to watch a utilization problem form rather than discover it in a quarterly close. Every one of those is a planning capability. Every one of them is something an advisory firm can build, package, and bill for.
The KPI set, and the two metrics that lie
A services dashboard that tracks everything tracks nothing. Three panels, in this order:
Leading: is work coming?
Pipeline coverage against the quarterly bookings target. Backlog as a percentage of the quarterly revenue target at quarter start. Bench days, and days from available to staffed. These move first, and they move before revenue does.
Operating: are we delivering it well?
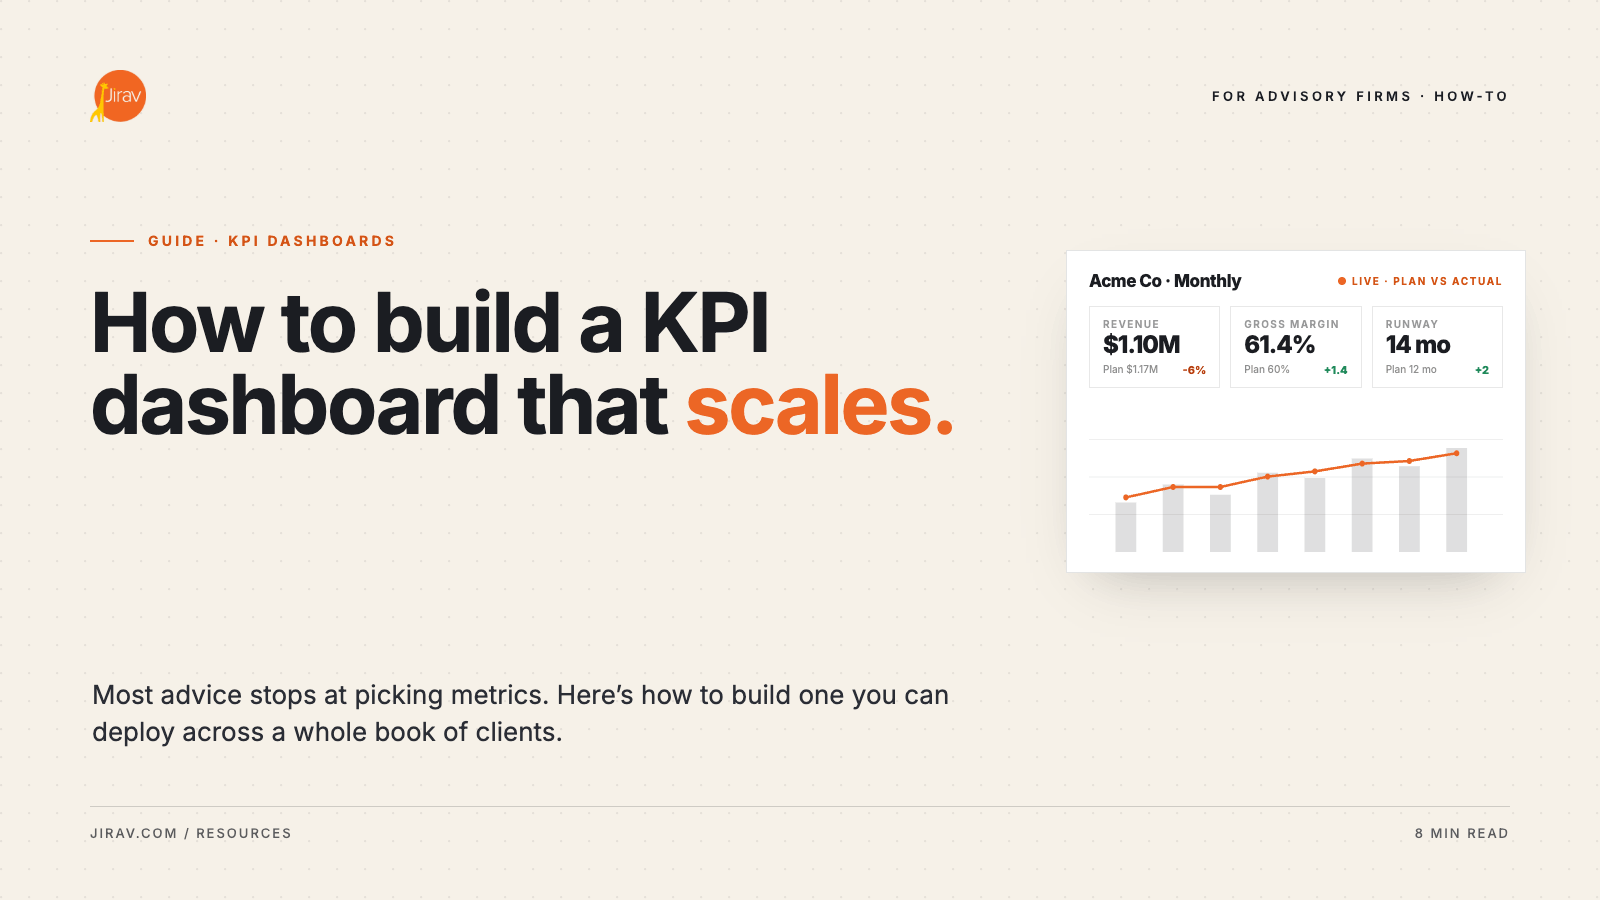
Billable utilization by role. Realization rate. Project margin, split by bill type. Project overrun against estimate. These are the levers a managing partner can actually pull inside a quarter.
Lagging: did it work?
Revenue per billable consultant. Revenue leakage. Days sales outstanding. EBITDA. Useful for the board deck, useless for steering.
Two metrics in that list mislead more often than the rest, and both do it quietly.
Blended utilization hides more than it shows. A firm reporting a comfortable 70% can be carrying partners at 45% and a delivery team at 88%, which is a pricing problem and a burnout problem wearing the same number. Segment by role or the metric is decorative.
Utilization and realization get conflated constantly. Utilization is billable hours divided by available hours: a capacity measure. Realization is revenue recognized divided by the standard value of hours billed: a pricing and scope measure. A firm can run utilization hot and still bleed, because the hours are being written off after the fact. Both belong on the dashboard, and they answer different questions.
Where the model usually lives, and why that stops working
Almost all of this starts in Excel, and that is not a failure of judgment. Excel is where every good financial model begins, and for one client with a stable team it holds up for a long time.
What it does not do is scale across a book. When the spreadsheet in question is the model a client is using to decide whether to hire three more consultants, that number stops being an academic curiosity.
The operational cost is more mundane and just as expensive. Every month someone re-imports the trial balance, repoints the formulas, rebuilds the headcount tab, and hopes the file open on screen is the current one. The model belongs to whoever built it. When that person leaves the firm, the engagement gets rebuilt from scratch, and the client pays for it twice.
Modeling is not reporting
This is the distinction worth being precise about, because a good deal of what gets sold to accounting firms as FP&A software is reporting software. Reporting tells you, often beautifully, what already happened. Modeling tells you what happens next if you change something. The buyer's guide to FP&A software for accounting firms works through that difference in detail.
Jirav is a modeling engine first, and the reporting is the output rather than the product. For a professional services engagement, three consequences follow.
- Workforce planning is native. Headcount, start dates, ramp curves, and compensation live inside the model and drive the top line as well as the expense line. For a services client that is the entire ballgame.
- The three statements move together. Change a start date and the income statement, balance sheet, and cash flow statement all respond, which is what driver-based planning and forecasting is supposed to mean and frequently does not.
- Auto Forecast produces a baseline in minutes. It generates a forecast from historicals and seasonality, which is where a client conversation should start rather than end. From there you replace trended lines with real drivers where the drivers matter, and leave them trended where they do not.
A forecast cadence that survives a busy quarter
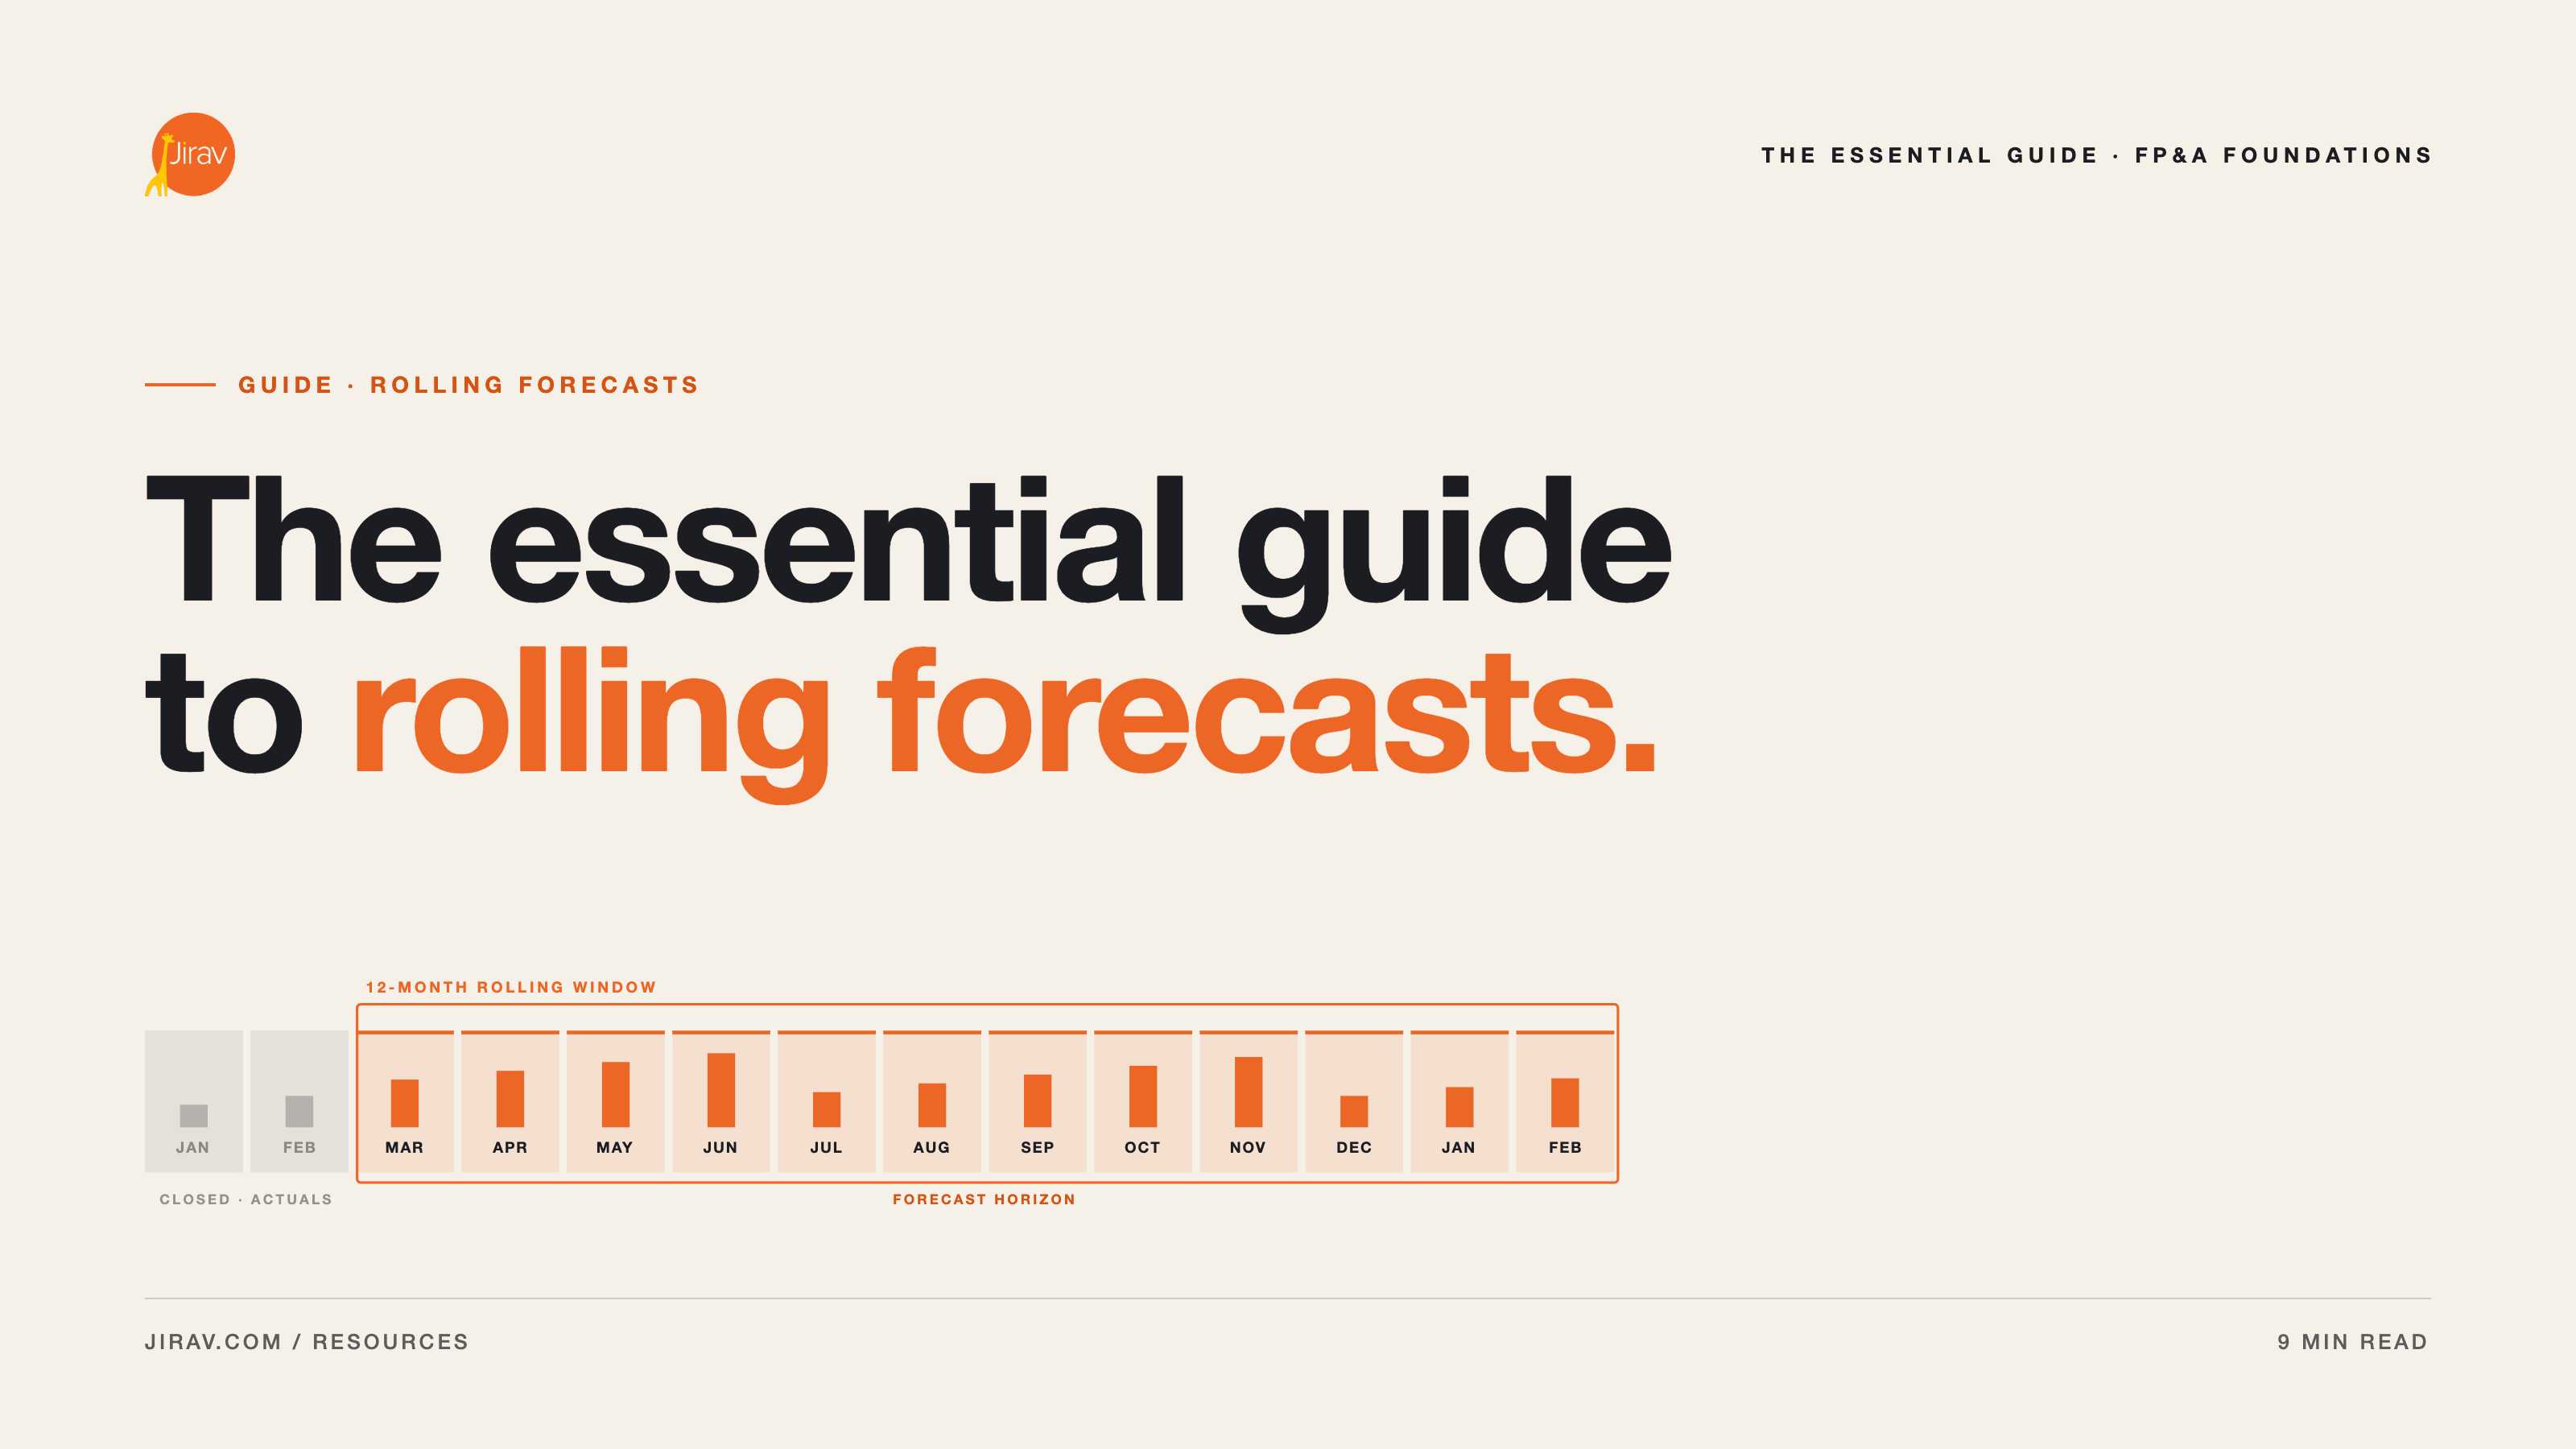
Run a rolling forecast, re-anchored monthly on actuals. An annual budget locked in November is archaeology by April in a business this sensitive to staffing decisions.
The scenarios worth pre-building for a professional services client are, almost without exception, workforce scenarios:
- Start dates slip one quarter. This is the single most common source of variance and the easiest to model badly.
- Ramp runs slower than planned. New hires reach target utilization in five months rather than three.
- Utilization erodes three points across the delivery team, without anyone deciding it should.
- An 8% rate concession wins a strategic account and resets the realized rate on 20% of the book.
Build those four once, clone them per client, and you can walk a managing partner through the cash consequences of a hiring decision live in the meeting instead of promising to come back with numbers by Friday.
Cash, meanwhile, is a receivables story for a services firm more than a profitability story. Working capital assumptions, billing milestones on the fixed fee book, and DSO are what determine runway, and a profitable services firm can still run out of money. The framework for choosing cash flow forecasting software covers where that forecast should live.
Build the model once, deploy it many times
The economics of an advisory practice do not work if every professional services engagement is bespoke. Standardize four things and the second engagement takes a fraction of the first: the chart of accounts mapping, the KPI panel, the report package, and the scenario set above.
Jirav ships industry blueprints built from delivery best practices, and the underlying model is customizable, so a professional services template built once can be cloned across the book. Standardized reports and dashboards travel with it. Firms that have made this shift tend to describe it the same way: they stopped selling hours and started selling a repeatable service, which is visible in their client results.
The short version
A professional services client is not a harder modeling problem than a SaaS client. It is a different one, and the difference is that the people are the product. Model the four drivers separately. Split fixed fee from time and materials. Segment utilization by role and never confuse it with realization. Re-anchor the forecast monthly. Do that, and you are doing CFO work rather than reporting work, which is the only version of this engagement worth pricing at CFO rates.
See how workforce-driven planning and forecasting works in Jirav, or book a demo and walk through it with a live client model.