.svg)


_BestResults_Small-Business_Total.png)
_MomentumLeader_Leader.png)
_EasiestToDoBusinessWith_Small-Business_EaseOfDoingBusinessWith.png)


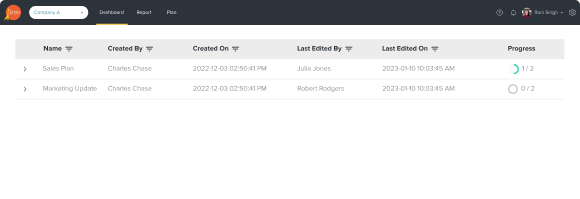
Align and execute on your ambitious vision.
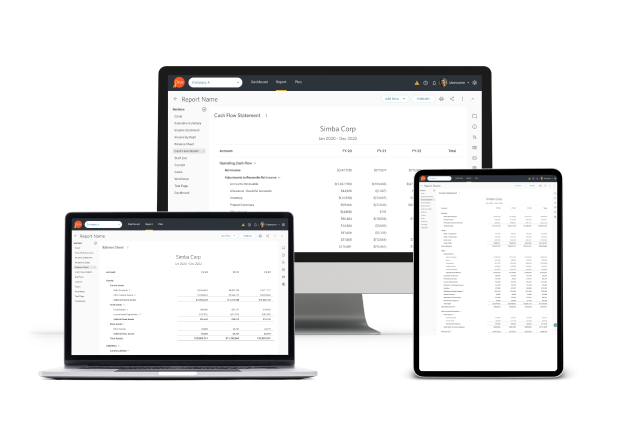
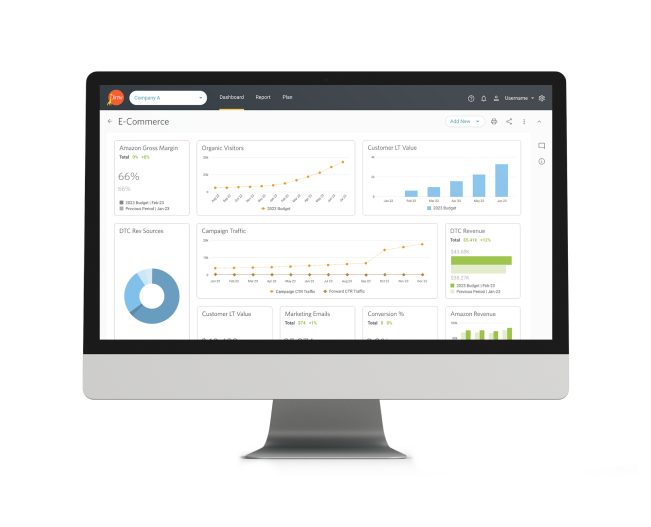
Reveal insights and showcase wins.
Uncover the answers to your critical questions, and reveal insights you never considered, with consistent Reporting and Dashboarding. Our library of ready-to-use and customizable reports is designed to suit your industry.
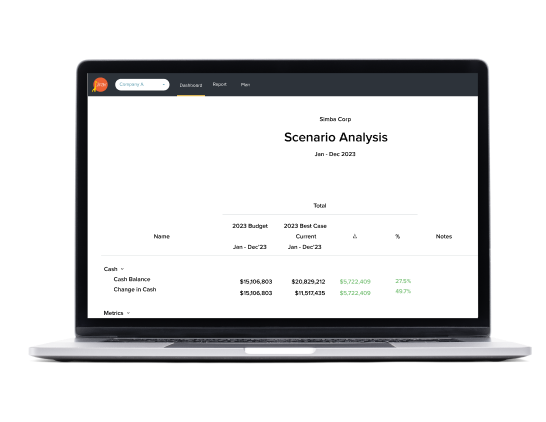
Balance risk and reward, with Scenario Planning.
Avoid analysis paralysis and focus on what moves the needle. Break down complex scenarios for clearer decision-making. You’ll have an answer for everything.
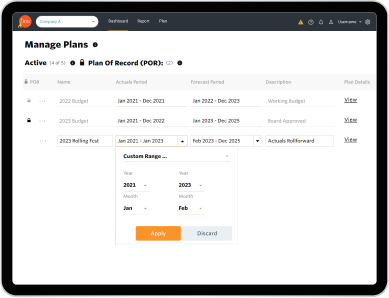
Drive your business, with Rolling Forecasts.
With Jirav's real-time pulse on business performance, you can adapt to any financial terrain. So take the driver's seat, and steer your business with Rolling Forecasts - the financial GPS you've been searching for.
Make a quantum leap, with the right tools.
Improve decision-making.
With Financial Modeling, spreadsheet mistakes will be a thing of the past, and business success will no longer be a pipe dream. Don’t just dream about it; take charge, and become the hero of your finance story.
Think proactively.
Predict the future and dodge crippling cash shortages, thanks to Cash Flow Forecasting. With this indispensable tool in your belt, you’ll be able to anticipate every ebb and flow, giving you the foresight to thrive in a competitive world.
Build the right team.
Workforce Planning is the key to harnessing the power of your most valuable asset: your team. Through rigorous analysis and strategic planning, you'll be equipped with the talent you need to get results.
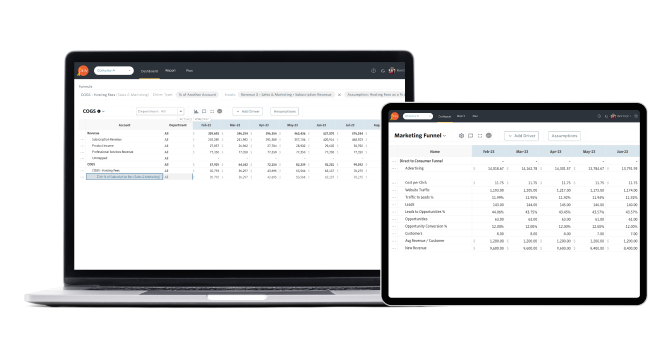
Financial Modeling
Improve decision-making.
With Financial Modeling, spreadsheet mistakes will be a thing of the past, and business success will no longer be a pipe dream. Don’t just dream about it; take charge, and become the hero of your finance story.
Cash Flow Forecasting
Think proactively.
Predict the future and dodge crippling cash shortages, thanks to Cash Flow Forecasting. With this indispensable tool in your belt, you’ll be able to anticipate every ebb and flow, giving you the foresight to thrive in a competitive world.
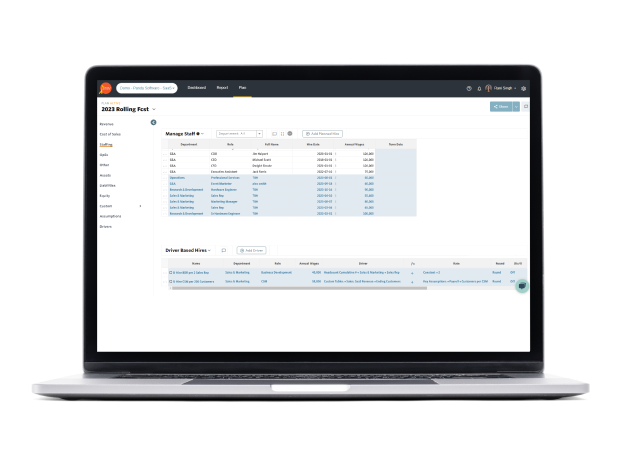
Workforce Planning
Build the right team.
Workforce Planning is the key to harnessing the power of your most valuable asset: your team. Through rigorous analysis and strategic planning, you'll be equipped with the talent you need to get results.
Hear it from other Jirav users…
I’ve been looking for this software for 10 years. I wanted FP&A for growth companies that can integrate with QuickBooks and analyze plan versus actuals. Jirav does what a growth company needs.
…We can set up custom drivers and KPIs for nearly anything so we can help our clients, and our own team, understand the big picture and make more intentional, impactful decisions.
I love the driver-based forecasting approach that Jirav provides… we use Jirav for all of our clients now, and they love being presented with something more visually pleasing than Excel spreadsheets!